
Page 222 - Membranes for Industrial Wastewater Recovery and Re-Use
P. 222
System desigri Rids 1 9 1
4.2.4 Computed solutions
For the simple scenario given in Table 4.4, implementation of both LM and
UMIST software provides the same limiting flow rate, corresponding to the
theoretical limit. However, the networks proposed by the two different software
packages differ (Figs. 4.12 and 4.13). Indeed, by allowing a variable flow rate
through the process, the UMIST software Water, which allows both approaches
(Le. fixed and non-fixed flow rates) projects flow rates lower then the limiting
ones. Using the LM WaterTarget'Q software, based on flow rates fixed at the
limiting value, the individual flow rates in the processes remain the same. To
achieve the same target flow rate, but constraining to a fixed process flow rate,
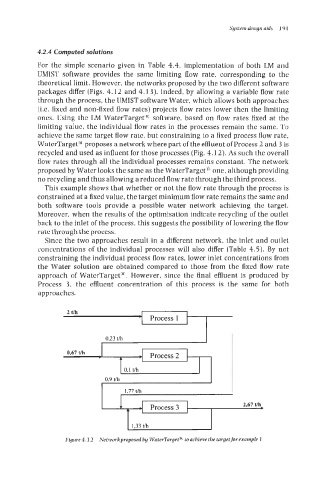
WaterTargetD proposes a network where part of the effluent of Process 2 and 3 is
recycled and used as influent for those processes (Fig. 4.12). As such the overall
flow rates through all the individual processes remains constant. The network
proposed by Water looks the same as the WaterTargetR one, although providing
no recycling and thus allowing a reduced flow rate through the third process.
This example shows that whether or not the flow rate through the process is
constrained at a fixed value, the target minimum flow rate remains the same and
both software tools provide a possible water network achieving the target.
Moreover, when the results of the optimisation indicate recycling of the outlet
back to the inlet of the process, this suggests the possibility of lowering the flow
rate through the process.
Since the two approaches result in a different network, the inlet and outlet
concentrations of the individual processes will also differ (Table 4.5). By not
constraining the individual process flow rates, lower inlet concentrations from
the Water solution are obtained compared to those from the fixed flow rate
approach of WaterTarget". However, since the final effluent is produced by
Process 3, the effluent concentration of this process is the same for both
approaches.
tth
Process 1
0.23 tlh I
0,67 t/h Process 2
0,l t/h
1.77 t/h
I Process 3 2,6? tlh
1,33 t/h
Figure4.12 Networkproposed bg WaterTargetZ toachieve the target for example I