
Page 292 - Membranes for Industrial Wastewater Recovery and Re-Use
P. 292
Casr stiidirs 2 h 1
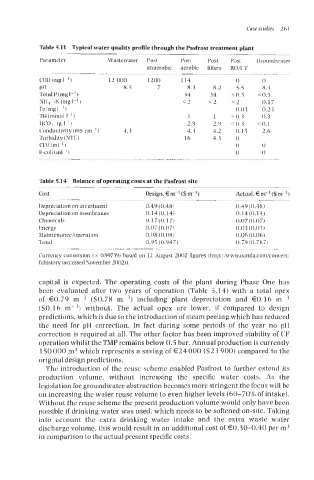
Table 5.13 Typical water quality profile through the Pasfrost treatment plant
~
Parameter Wastewater Post Post Post Post Groundwater
anaerobic aerobic filters RO/UV
~
COD(mgl ’) 12 000 1200 114 0 0
PH 8.5 3 8.3 8.2 5.5 8.3
Total P (mg I-’ ) 34 34 c0.i cO.5
NH4+-N (mg I-’ <7 (2 <2 0.17
Fe (mg I-‘ 0.0 3 0.2 3
)
TH (mmol I-’ ) 1 1 > 0.3 0.3
HC’O<-(g IF’) 2.9 2.9 < 0.3 e 0.1
Conductivity (mS cm-’ ) 4.3 4.3 4.2 0.1 5 2.6
Turbidity (NTIJ) 16 4.3 0
CFU (rn1-l) 0 0
E-coli (ml-’ 1 0 0
Table 5.14 Balance of operating costs at the Pasfrost site
Cost Design. m-’ ($ m-3)
Depreciation on investment 0.49 (0.48) 0.49 (0.48)
Depreciation on membranes 0.14 (0.14) 0.14(0.14)
Chemicals 0.1 7 (0.1 7) 0.07 (0.07)
Energy 0.07 (0.07) 0.03 (0.03)
Main tenance/operation 0.08 (0.081 0.06 (0.06)
Total 0.95 (0.947) 0.79 (0.787)
~
Currency conversion (x 0.99739) based on 12 August 2002 figures (http://www.oanda.com/conrerti
fxhistory (accessed November 2002)).
capital is expected. The operating costs of the plant during Phase One has
been evaluated after two years of operation (Table 5.14) with a total opex
of €0.79 mP3 ($0.78 m-3) including plant depreciation and €0.16 m
($0.16 m-3) without. The actual opex are lower, if compared to design
predictions. which is due to the introduction of steam peeling which has reduced
the need for pH correction. In fact during some periods of the year no pH
correction is required at aI1. The other factor has been improved stability of UF
operation whilst the TMP remains below 0.5 bar. Annual production is currently
150 000 m3 which represents a saving of €24 000 ($23 900) compared to the
original design predictions.
The introduction of the reuse scheme enabled Pasfrost to further extend its
production volume, without increasing thc specific water costs. As the
legislation for groundwater abstraction becomes more stringent the focus will be
on increasing the water reuse volume to even higher levels (60-700/0 of intake).
Without the reuse scheme the present production volume would only have been
possible if drinking water was used, which needs to be softened on-site. Taking
into account the extra drinking water intake and the extra waste water
discharge volume, this would result in an additional cost of aI.3O-O.4O per m3
in comparison to the actual present specific costs.