
Page 119 -
P. 119
3.3 Experimental Measurement and Comparison 109
(a) (b)
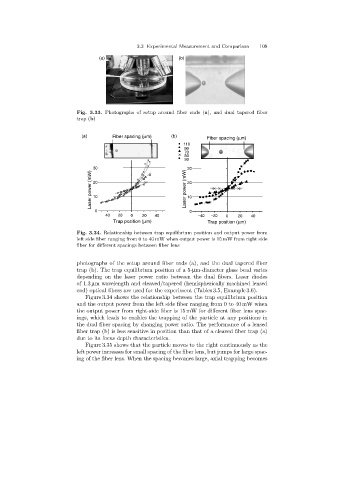
Fig. 3.33. Photographs of setup around fiber ends (a), and dual tapered fiber
trap (b)
(a) Fiber spacing (mm) (b) Fiber spacing (mm)
110
90
70
50
30
30 30
Laser power (mW) 20 Laser power (mW) 20
10
10
0 0
-40 -20 0 20 40 -40 -20 0 20 40
Trap position (mm) Trap position (mm)
Fig. 3.34. Relationship between trap equilibrium position and output power from
left side fiber ranging from 0 to 40 mW when output power is 15 mW from right side
fiber for different spacings between fiber lens
photographs of the setup around fiber ends (a), and the dual tapered fiber
trap (b). The trap equilibrium position of a 5-µm-diameter glass bead varies
dependingon the laser power ratio between the dual fibers. Laser diodes
of 1.3 µm wavelength and cleaved/tapered (hemispherically machined lensed
end) optical fibers are used for the experiment (Tables 3.5, Example 3.6).
Figure 3.34 shows the relationship between the trap equilibrium position
and the output power from the left side fiber ranging from 0 to 40 mW when
the output power from right-side fiber is 15 mW for different fiber lens spac-
ings, which leads to enables the trapping of the particle at any positions in
the dual fiber spacingby changingpower ratio. The performance of a lensed
fiber trap (b) is less sensitive in position than that of a cleaved fiber trap (a)
due to its focus depth characteristics.
Figure 3.35 shows that the particle moves to the right continuously as the
left power increases for small spacingof the fiber lens, but jumps for large spac-
ingof the fiber lens. When the spacingbecomes large, axial trappingbecomes