
Page 120 -
P. 120
110 3 Optical Tweezers
(a) 30 (3) (b) (1)
Laser power (mW) 20 (1) (2) (4) Power (2)
down
Power up
(3)
(5)
10
Fiber spacing (micrometer) (4)
110
90
(5)
70
0
-40 -20 0 20 40
Trap position (mm) Glass (10 mm)
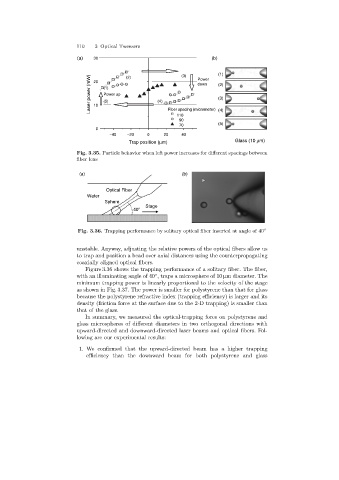
Fig. 3.35. Particle behavior when left power increases for different spacings between
fiber lens
(a) (b)
Optical Fiber
Water
Sphere
Stage
40
Fig. 3.36. Trapping performance by solitary optical fiber inserted at angle of 40 ◦
unstable. Anyway, adjustingthe relative powers of the optical fibers allow us
to trap and position a bead over axial distances usingthe counterpropagating
coaxially aligned optical fibers.
Figure 3.36 shows the trapping performance of a solitary fiber. The fiber,
with an illuminatingangle of 40 , traps a microsphere of 10 µm diameter. The
◦
minimum trappingpower is linearly proportional to the velocity of the stage
as shown in Fig. 3.37. The power is smaller for polystyrene than that for glass
because the polystyrene refractive index (trappingefficiency) is larger and its
density (friction force at the surface due to the 2-D trapping) is smaller than
that of the glass.
In summary, we measured the optical-trappingforce on polystyrene and
glass microspheres of different diameters in two orthogonal directions with
upward-directed and downward-directed laser beams and optical fibers. Fol-
lowingare our experimental results:
1. We confirmed that the upward-directed beam has a higher trapping
efficiency than the downward beam for both polystyrene and glass