
Page 115 -
P. 115
3.3 Experimental Measurement and Comparison 105
(a) (b)
CCD
YAG laser
Objective
Stage
Objective Stage
Microscope
Fig. 3.27. Photograph of optical trapping apparatus. Upper and lower objective
lenses are seen around the microscope stage lower left in (a). Two objective lenses
used in trapping particles in water with downward-directed and upward-directed
laser beams (b)
Minimum trapping power (mW) 0.3 Upward directed Minimum trapping power (mW) 3 Upward directed
(a) 0.4 (b) 4
0.2
2
Downward
Downward
0.1
1
0
0
4
2
6
2
6
4
Particle diameter (mm) 8 0 0 Particle diameter (mm) 8
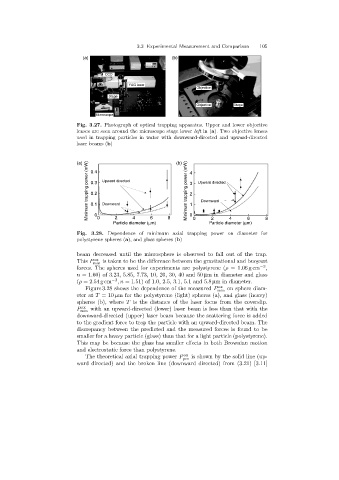
Fig. 3.28. Dependence of minimum axial trapping power on diameter for
polystyrene spheres (a), and glass spheres (b)
beam decreased until the microsphere is observed to fall out of the trap.
This P ax is taken to be the difference between the gravitational and buoyant
min
forces. The spheres used for experiments are polystyrene (ρ =1.06 gcm −3 ,
n =1.60) of 3.23, 5.85, 7.73, 10, 20, 30, 40 and 50 µm in diameter and glass
(ρ =2.54 gcm −3 ,n =1.51) of 1.0, 2.5, 3.1, 5.1 and 5.8 µm in diameter.
ax
Figure 3.28 shows the dependence of the measured P min on sphere diam-
eter at T =10 µm for the polystyrene (light) spheres (a), and glass (heavy)
spheres (b), where T is the distance of the laser focus from the coverslip.
ax
P min with an upward-directed (lower) laser beam is less than that with the
downward-directed (upper) laser beam because the scatteringforce is added
to the gradient force to trap the particle with an upward-directed beam. The
discrepancy between the predicted and the measured forces is found to be
smaller for a heavy particle (glass) than that for a light particle (polystyrene).
This may be because the glass has smaller effects in both Brownian motion
and electrostatic force than polystyrene.
The theoretical axial trappingpower P ax is shown by the solid line (up-
pre
ward directed) and the broken line (downward directed) from (3.21) [3.11]