
Page 141 -
P. 141
4.2 Theoretical Analysis I – Optical Torque 131
0.01
0 NA=0.8
Trapping efficiency -0.01
-0.02
-0.03
-0.04 a=45 1.0
a=20
-0.05 1.2
-3 -2 -1 0 1 2 3
Beam waist position (mm)
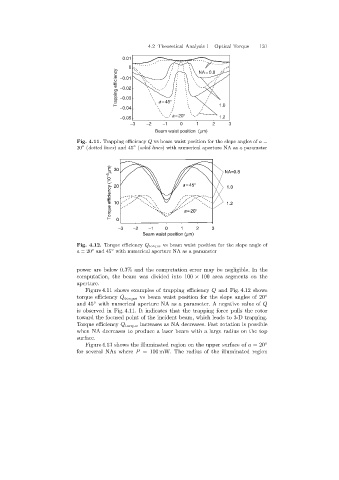
Fig. 4.11. Trapping efficiency Q vs beam waist position for the slope angles of a =
◦
20 (dotted lines)and 45 (solid lines)with numerical aperture NA as a parameter
◦
Torque efficiency (10 -3 mm) 20 a=45 NA=0.8
30
1.0
10
1.2
a=20
0
-3 -2 -1 0 1 2 3
Beam waist position (mm)
Fig. 4.12. Torque efficiency Q torque vs beam waist position for the slope angle of
a =20 and 45 with numerical aperture NA as a parameter
◦
◦
power are below 0.3% and the computation error may be negligible. In the
computation, the beam was divided into 100 × 100 area segments on the
aperture.
Figure 4.11 shows examples of trapping efficiency Q and Fig. 4.12 shows
torque efficiency Q torque vs beam waist position for the slope angles of 20 ◦
◦
and 45 with numerical aperture NA as a parameter. A negative value of Q
is observed in Fig. 4.11. It indicates that the trapping force pulls the rotor
toward the focused point of the incident beam, which leads to 3-D trapping.
Torque efficiency Q torque increases as NA decreases. Fast rotation is possible
when NA decreases to produce a laser beam with a large radius on the top
surface.
Figure 4.13 shows the illuminated region on the upper surface of a =20 ◦
for several NAs where P = 100 mW. The radius of the illuminated region