
Page 117 - A Practical Guide from Design Planning to Manufacturing
P. 117
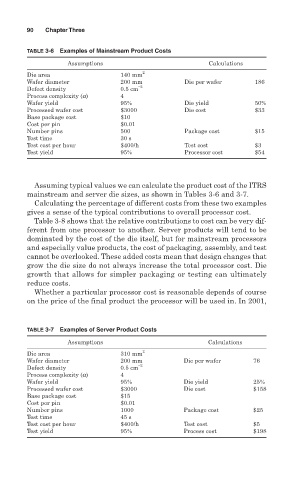
90   Chapter Three

        TABLE 3-6  Examples of Mainstream Product Costs
                   Assumptions                           Calculations
        Die area                  140 mm 2
        Wafer diameter            200 mm           Die per wafer      186
        Defect density            0.5 cm −2
        Process complexity (a)    4
        Wafer yield               95%              Die yield          50%
        Processed wafer cost      $3000            Die cost           $33
        Base package cost         $10
        Cost per pin              $0.01
        Number pins               500              Package cost       $15
        Test time                 30 s
        Test cost per hour        $400/h           Test cost          $3
        Test yield                95%              Processor cost     $54


          Assuming typical values we can calculate the product cost of the ITRS
        mainstream and server die sizes, as shown in Tables 3-6 and 3-7.
          Calculating the percentage of different costs from these two examples
        gives a sense of the typical contributions to overall processor cost.
          Table 3-8 shows that the relative contributions to cost can be very dif-
        ferent from one processor to another. Server products will tend to be
        dominated by the cost of the die itself, but for mainstream processors
        and especially value products, the cost of packaging, assembly, and test
        cannot be overlooked. These added costs mean that design changes that
        grow the die size do not always increase the total processor cost. Die
        growth that allows for simpler packaging or testing can ultimately
        reduce costs.
          Whether a particular processor cost is reasonable depends of course
        on the price of the final product the processor will be used in. In 2001,


        TABLE 3-7  Examples of Server Product Costs

                   Assumptions                           Calculations
        Die area                  310 mm 2
        Wafer diameter            200 mm           Die per wafer      76
        Defect density            0.5 cm −2
        Process complexity (a)    4
        Wafer yield               95%              Die yield         25%
        Processed wafer cost      $3000            Die cost           $158
        Base package cost         $15
        Cost per pin              $0.01
        Number pins               1000             Package cost       $25
        Test time                 45 s
        Test cost per hour        $400/h           Test cost          $5
        Test yield                95%              Process cost       $198