
Page 303 - Microsensors, MEMS and Smart Devices - Gardner Varadhan and Awadelkarim
P. 303
BIO(CHEMICAL) SENSORS 283
Figure 8.51 (a) Basic structure of a Taguchi-type tin oxide gas sensors and (b) photograph of a
series-8 commercial gas sensor (Courtesy of Figaro Engineering, Japan)
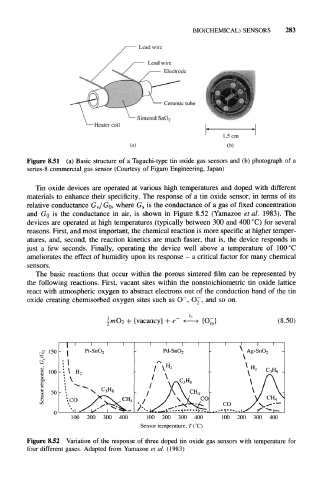
Tin oxide devices are operated at various high temperatures and doped with different
materials to enhance their specificity. The response of a tin oxide sensor, in terms of its
is the conductance of a gas of fixed concentration
relative conductance G s/G 0, where G s
and GO is the conductance in air, is shown in Figure 8.52 (Yamazoe et al. 1983). The
devices are operated at high temperatures (typically between 300 and 400 °C) for several
reasons. First, and most important, the chemical reaction is more specific at higher temper-
atures, and, second, the reaction kinetics are much faster, that is, the device responds in
just a few seconds. Finally, operating the device well above a temperature of 100 °C
ameliorates the effect of humidity upon its response - a critical factor for many chemical
sensors.
The basic reactions that occur within the porous sintered film can be represented by
the following reactions. First, vacant sites within the nonstoichiometric tin oxide lattice
react with atmospheric oxygen to abstract electrons out of the conduction band of the tin
-
oxide creating chemisorbed oxygen sites such as O , O 2, and so on.
+ {vacancy} + e~ (8.50)
Pd-SnO,
100
9 50
CO
..-•I---
100 200 300 400 100 200 300 400 100 200 300 400
Sensor temperature, 7'(°C)
Figure 8.52 Variation of the response of three doped tin oxide gas sensors with temperature for
four different gases. Adapted from Yamazoe et al. (1983)