
Page 329 - Microsensors, MEMS and Smart Devices - Gardner Varadhan and Awadelkarim
P. 329
ACOUSTIC WAVES 309
Rayleigh wave
Figure 9.4 Surface acoustic waves generated in quartz by IDTs
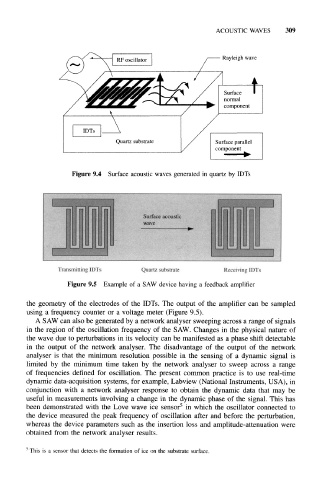
Figure 9.5 Example of a SAW device having a feedback amplifier
the geometry of the electrodes of the IDTs. The output of the amplifier can be sampled
using a frequency counter or a voltage meter (Figure 9.5).
A SAW can also be generated by a network analyser sweeping across a range of signals
in the region of the oscillation frequency of the SAW. Changes in the physical nature of
the wave due to perturbations in its velocity can be manifested as a phase shift detectable
in the output of the network analyser. The disadvantage of the output of the network
analyser is that the minimum resolution possible in the sensing of a dynamic signal is
limited by the minimum time taken by the network analyser to sweep across a range
of frequencies defined for oscillation. The present common practice is to use real-time
dynamic data-acquisition systems, for example, Labview (National Instruments, USA), in
conjunction with a network analyser response to obtain the dynamic data that may be
useful in measurements involving a change in the dynamic phase of the signal. This has
5
been demonstrated with the Love wave ice sensor in which the oscillator connected to
the device measured the peak frequency of oscillation after and before the perturbation,
whereas the device parameters such as the insertion loss and amplitude-attenuation were
obtained from the network analyser results.
5
This is a sensor that detects the formation of ice on the substrate surface.