
Page 363 - Microsensors, MEMS and Smart Devices - Gardner Varadhan and Awadelkarim
P. 363
MEASUREMENT SETUP 343
fref x f sample
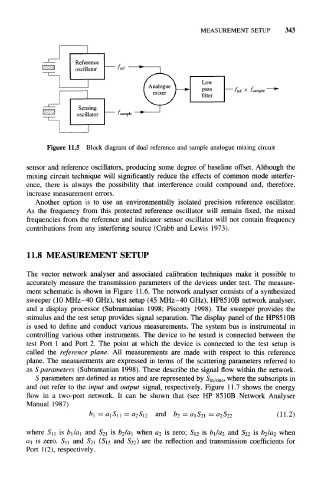
Figure 11.5 Block diagram of dual reference and sample analogue mixing circuit
sensor and reference oscillators, producing some degree of baseline offset. Although the
mixing circuit technique will significantly reduce the effects of common mode interfer-
ence, there is always the possibility that interference could compound and, therefore,
increase measurement errors.
Another option is to use an environmentally isolated precision reference oscillator.
As the frequency from this protected reference oscillator will remain fixed, the mixed
frequencies from the reference and indicator sensor oscillator will not contain frequency
contributions from any interfering source (Crabb and Lewis 1973).
11.8 MEASUREMENT SETUP
The vector network analyser and associated calibration techniques make it possible to
accurately measure the transmission parameters of the devices under test. The measure-
ment schematic is shown in Figure 11.6. The network analyser consists of a synthesized
sweeper (10 MHz-40 GHz), test setup (45 MHz-40 GHz), HP8510B network analyser,
and a display processor (Subramanian 1998; Piscotty 1998). The sweeper provides the
stimulus and the test setup provides signal separation. The display panel of the HP8510B
is used to define and conduct various measurements. The system bus is instrumental in
controlling various other instruments. The device to be tested is connected between the
test Port 1 and Port 2. The point at which the device is connected to the test setup is
called the reference plane. All measurements are made with respect to this reference
plane. The measurements are expressed in terms of the scattering parameters referred to
as S parameters (Subramanian 1998). These describe the signal flow within the network.
S parameters are defined as ratios and are represented by S inn/ out, where the subscripts in
and out refer to the input and output signal, respectively. Figure 11.7 shows the energy
flow in a two-port network. It can be shown that (see HP 8510B Network Analyser
Manual 1987)
b 1 = a 1S 11 = a 2 S 12 and b 2 = a 1 S 21 = a 2S 22 (11–2)
where S 11 is b\la\ and 5 21 is b 2la 1 when a 2 is zero; 5 12 is b\la 2 and 522 is b 2/a 2 when
a\ is zero. S\\ and 5 21 (5i2 and 522) are the reflection and transmission coefficients for
Port 1(2), respectively.