
Page 146 - Modern Analytical Chemistry
P. 146
1400-CH05 9/8/99 3:59 PM Page 129
Chapter 5 Calibrations, Standardizations, and Blank Corrections 129
tions between the analyte and the sample matrix. Both the calibration blank and
the reagent blank correct for signals due to the reagents and solvents. Any differ-
ence in their values is due to the number and composition of samples contribut-
ing to the determination of the blank.
Unfortunately, neither the calibration blank nor the reagent blank can cor-
rect for bias due to analyte–matrix interactions because the analyte is missing in
the reagent blank, and the sample’s matrix is missing from the calibration blank.
The true method blank must include both the matrix and the analyte and, conse-
quently, can only be determined using the sample itself. One approach is to mea-
sure the signal for samples of different size and determine the regression line
from a plot of signal versus the amount of sample. The resulting y-intercept gives
the signal for the condition of no sample and is known as the total Youden total Youden blank
13
blank. This is the true blank correction. The regression line for the sample data A blank that corrects the signal for
analyte–matrix interactions.
in Table 5.3 is
S samp = 0.009844 ´W x + 0.185
giving a true blank correction of 0.185. Using this value to correct the signals
gives identical values for the concentration of analyte in all three samples (see
Table 5.4, bottom row).
The total Youden blank is not encountered frequently in analytical work,
because most chemists rely on a calibration blank when using calibration curves
and rely on reagent blanks when using a single-point standardization. As long
as any constant bias due to analyte–matrix interactions can be ignored, which
is often the case, the accuracy of the method will not suffer. It is always a
good idea, however, to check for constant sources of error, by analyzing
samples of different sizes, before relying on either a calibration or reagent
blank.
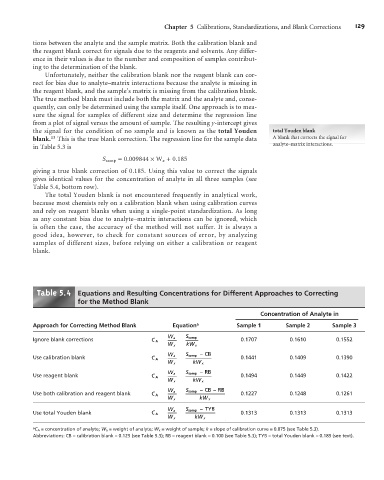
5 4
Table . Equations and Resulting Concentrations for Different Approaches to Correcting
for the Method Blank
Concentration of Analyte in
Approach for Correcting Method Blank Equation a Sample 1 Sample 2 Sample 3
Ignore blank corrections C A = W a = S samp 0.1707 0.1610 0.1552
W x kW x
S samp – CB
Use calibration blank C A = W a = 0.1441 0.1409 0.1390
W x kW x
S samp – RB
Use reagent blank C A = W a = 0.1494 0.1449 0.1422
W x kW x
S samp – CB – RB
Use both calibration and reagent blank C A = W a = 0.1227 0.1248 0.1261
W x kW x
S samp – TYB
W a
Use total Youden blank C A = = 0.1313 0.1313 0.1313
W x kW x
a C A = concentration of analyte; W a = weight of analyte; W x = weight of sample; k = slope of calibration curve = 0.075 (see Table 5.3).
Abbreviations: CB = calibration blank = 0.125 (see Table 5.3); RB = reagent blank = 0.100 (see Table 5.3); TYB = total Youden blank = 0.185 (see text).