
Page 145 - Modern Analytical Chemistry
P. 145
1400-CH05 9/8/99 3:59 PM Page 128
128 Modern Analytical Chemistry
5 D Blank Corrections
In discussing ways to standardize a method, we assumed that an appropriate
reagent blank had been used to correct S meas for signals originating from sources
other than the analyte. At that time we did not ask an important question—
“What constitutes an appropriate reagent blank?” Surprisingly, the answer is not
intuitively obvious.
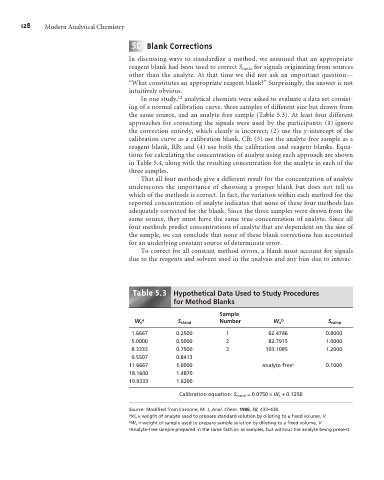
In one study, 12 analytical chemists were asked to evaluate a data set consist-
ing of a normal calibration curve, three samples of different size but drawn from
the same source, and an analyte-free sample (Table 5.3). At least four different
approaches for correcting the signals were used by the participants: (1) ignore
the correction entirely, which clearly is incorrect; (2) use the y-intercept of the
calibration curve as a calibration blank, CB; (3) use the analyte-free sample as a
reagent blank, RB; and (4) use both the calibration and reagent blanks. Equa-
tions for calculating the concentration of analyte using each approach are shown
in Table 5.4, along with the resulting concentration for the analyte in each of the
three samples.
That all four methods give a different result for the concentration of analyte
underscores the importance of choosing a proper blank but does not tell us
which of the methods is correct. In fact, the variation within each method for the
reported concentration of analyte indicates that none of these four methods has
adequately corrected for the blank. Since the three samples were drawn from the
same source, they must have the same true concentration of analyte. Since all
four methods predict concentrations of analyte that are dependent on the size of
the sample, we can conclude that none of these blank corrections has accounted
for an underlying constant source of determinate error.
To correct for all constant method errors, a blank must account for signals
due to the reagents and solvent used in the analysis and any bias due to interac-
5 3
Table . Hypothetical Data Used to Study Procedures
for Method Blanks
Sample
a b
W s S stand Number W x S samp
1.6667 0.2500 1 62.4746 0.8000
5.0000 0.5000 2 82.7915 1.0000
8.3333 0.7500 3 103.1085 1.2000
9.5507 0.8413
11.6667 1.0000 analyte-free c 0.1000
18.1600 1.4870
19.9333 1.6200
Calibration equation: S stand = 0.0750 ´W s + 0.1250
Source: Modified from Cardone, M. J. Anal. Chem. 1986, 58, 433–438.
a W s = weight of analyte used to prepare standard solution by diluting to a fixed volume, V.
b W x = weight of sample used to prepare sample solution by diluting to a fixed volume, V.
c Analyte-free sample prepared in the same fashion as samples, but without the analyte being present.