Page 59 - Modern Control Systems
P. 59

Section  1.10  Sequential  Design Example: Disk  Drive Read System   33

                                                                     /(;)   Insulin
                                       Programmed
                                                                          •  delivery
                                      signal generator
                                                                             rate
                                                          (a)

                                                                 Insulin
                                                         Motor,   delivery   Human
                                                 v(t)    pump,    rate    body,          Actual
                                        Amplifier
                                                         and             blood, and
                                                                                         level
                                                         valve           pancreas
      FIGURE 1.27
      (a) Open-loop            > j                       Sensor
      (without  feedback)     (  ^   Measured glucose level
      control and
      (b) closed-loop   Desired glucose level
      control  of blood
      glucose.                                            Cb)

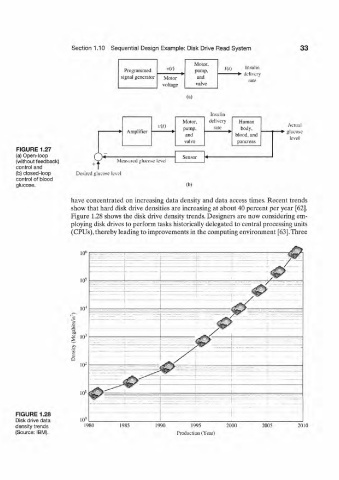
                       have concentrated  on increasing  data  density  and  data  access times. Recent  trends
                       show that hard  disk drive densities are increasing at about  40 percent per year [62],
                       Figure  1.28  shows the disk drive density trends. Designers are  now considering em-
                       ploying disk drives to perform  tasks historically delegated to central processing units
                       (CPUs), thereby leading to improvements in the computing environment  [63].Three


                       •Jr


      FIGURE  1.28
      Disk drive data
      density trends       1980       1955      1990       1995       2000       2005       2010
      (Source: IBM).                                   Production (Year)
   54   55   56   57   58   59   60   61   62   63   64