
Page 89 - Modern Control Systems
P. 89
Section 2.4 The Laplace Transform 63
£=0 Ja>
£ increasing / / \ .
0
<r=i y
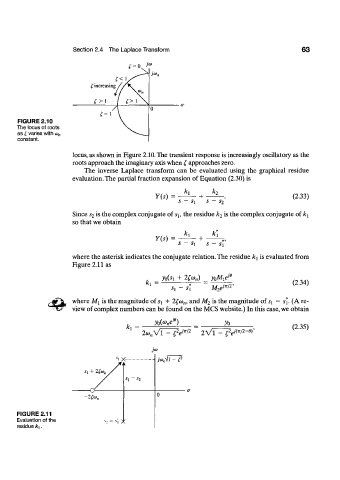
FIGURE 2.10
The locus of roots
as £ varies with <a n
constant.
locus, as shown in Figure 2.10. The transient response is increasingly oscillatory as the
roots approach the imaginary axis when £ approaches zero.
The inverse Laplace transform can be evaluated using the graphical residue
evaluation. The partial fraction expansion of Equation (2.30) is
Y(s) = * i + —. (2.33)
5 - S X S — S 2
Since s 2 is the complex conjugate of s h the residue k 2 is the complex conjugate of k x
so that we obtain
s - Si s - si
where the asterisk indicates the conjugate relation. The residue k\ is evaluated from
Figure 2.11 as
70(5! + 2£(o n) ^ y QM xe }B
(2.34)
* i ;V/r
sy — s[ M 2 e
where M x is the magnitude of S\ + 2£<o„, and M 2 is the magnitude of ^ - s*. (A re-
view of complex numbers can be found on the MCS website.) In this case, we obtain
ie
yo(<o ne ) yo
* i 2 M2 (7r/2_e) (2.35)
2(o nVl - C e 2Vl - ^V '
s
\ + l&n
FIGURE 2.11
Evaluation of the