
Page 30 - Modern Optical Engineering The Design of Optical Systems
P. 30
Optics Overview 13
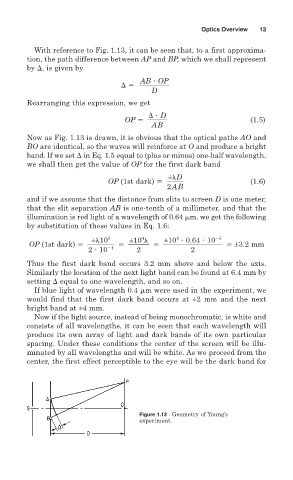
With reference to Fig. 1.13, it can be seen that, to a first approxima-
tion, the path difference between AP and BP, which we shall represent
by
, is given by
AB OP
D
Rearranging this expression, we get
D
OP (1.5)
AB
Now as Fig. 1.13 is drawn, it is obvious that the optical paths AO and
BO are identical, so the waves will reinforce at O and produce a bright
band. If we set
in Eq. 1.5 equal to (plus or minus) one-half wavelength,
we shall then get the value of OP for the first dark band
± D
OP (1st dark) (1.6)
2AB
and if we assume that the distance from slits to screen D is one meter,
that the slit separation AB is one-tenth of a millimeter, and that the
illumination is red light of a wavelength of 0.64 m, we get the following
by substitution of these values in Eq. 1.6:
4
4
± 10 3 ±10 ±10 0.64 10 3
OP (1st dark) ±3.2 mm
2 10 1 2 2
Thus the first dark band occurs 3.2 mm above and below the axis.
Similarly the location of the next light band can be found at 6.4 mm by
setting
equal to one wavelength, and so on.
If blue light of wavelength 0.4 m were used in the experiment, we
would find that the first dark band occurs at ±2 mm and the next
bright band at ±4 mm.
Now if the light source, instead of being monochromatic, is white and
consists of all wavelengths, it can be seen that each wavelength will
produce its own array of light and dark bands of its own particular
spacing. Under these conditions the center of the screen will be illu-
minated by all wavelengths and will be white. As we proceed from the
center, the first effect perceptible to the eye will be the dark band for
Figure 1.13 Geometry of Young’s
experiment.