
Page 256 - Modern Spatiotemporal Geostatistics
P. 256
Popular Methods in the Light of Modern Geostatistics 237
Figure 12.2. Average error difference Ae (over all points p k e D) between
BME and SK as a function of the time interval At.
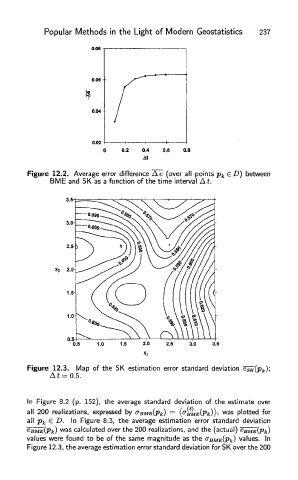
Figure 12.3. Map of the SK estimation error standard deviation e SK(p k);
At = 0.5.
In Figure 8.2 (p. 152), the average standard deviation of the estimate over
ff
all 200 realizations, expressed by cr BME(pk) — ( BME(Pk)}< was plotted for
all p h € D. In Figure 8.3, the average estimation error standard deviation
was calculated over the 200 realizations, and the (actual) eBME(pk)
values were found to be of the same magnitude as the <r BME(Pk} values. In
Figure 12.3, the average estimation error standard deviation for SK over the 200