
Page 258 - Modern Spatiotemporal Geostatistics
P. 258
Popular Methods in the Light of Modern Geostatistics 239
The next example is a continuation of the geostatistical analysis of the
porosity data collected in the West Lyons field of west-central Kansas (Chapter
7, p. 143). This example provides numerical results showing that: (a) the SK
and BME maps coincide when the same hard data and low-order moments are
assumed (an outcome that is, of course, to be expected from theory); and (b)
the BME method produces better maps than SK when additional soft data
become available.
EXAMPLE 12.8: Consider the West Lyons porosity data set presented in Chap-
ter 7 and Figure 7.4 (p. 145). A total of 76 data values were available. The
general knowledge that was considered included the porosity mean and the co-
variance model plotted in Figure 7.4. Using all 76 hard data, the SK technique
reproduces the map in Figure 7.5, which was the map obtained by the BME
method using the same hard data, mean, and covariance model. Furthermore,
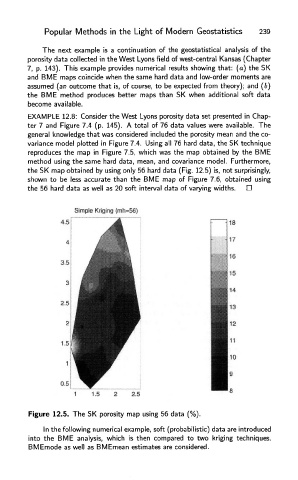
the SK map obtained by using only 56 hard data (Fig. 12.5) is, not surprisingly,
shown to be less accurate than the BME map of Figure 7.6, obtained using
the 56 hard data as well as 20 soft interval data of varying widths.
Figure 12.5. The SK porosity map using 56 data (%).
In the following numerical example, soft (probabilistic) data are introduced
into the BME analysis, which is then compared to two kriging techniques.
BMEmode as well as BMEmean estimates are considered.