
Page 262 - Modern Spatiotemporal Geostatistics
P. 262
Popular Methods in the Light of Modern Geostatistics 243
set included both hard and soft (interval and probabilistic) data in space/time.
The BME and SK confidence intervals derived at a number of selected wells
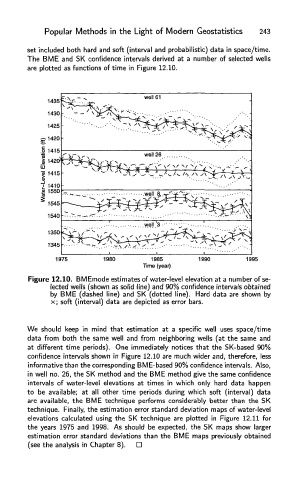
are plotted as functions of time in Figure 12.10.
Figure 12.10. BMEmode estimates of water-level elevation at a number of se-
lected wells (shown as solid line) and 90% confidence intervals obtained
by BME (dashed line) and SK (dotted line). Hard data are shown by
x; soft (interval) data are depicted as error bars.
We should keep in mind that estimation at a specific well uses space/time
data from both the same well and from neighboring wells (at the same and
at different time periods). One immediately notices that the SK-based 90%
confidence intervals shown in Figure 12.10 are much wider and, therefore, less
informative than the corresponding BME-based 90% confidence intervals. Also,
in well no. 26, the SK method and the BME method give the same confidence
intervals of water-level elevations at times in which only hard data happen
to be available; at all other time periods during which soft (interval) data
are available, the BME technique performs considerably better than the SK
technique. Finally, the estimation error standard deviation maps of water-level
elevations calculated using the SK technique are plotted in Figure 12.11 for
the years 1975 and 1998. As should be expected, the SK maps show larger
estimation error standard deviations than the BME maps previously obtained
(see the analysis in Chapter 8).