
Page 261 - Modern Spatiotemporal Geostatistics
P. 261
242 Modern Spatiotemporal Geostatistics — Chapter 12
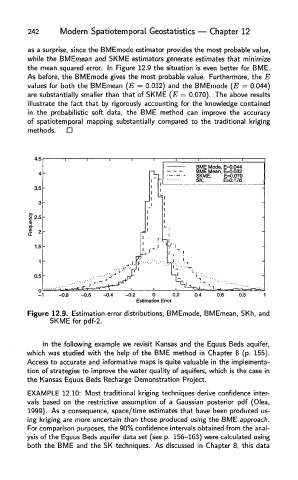
as a surprise, since the BMEmode estimator provides the most probable value,
while the BMEmean and SKME estimators generate estimates that minimize
the mean squared error. In Figure 12.9 the situation is even better for BME.
As before, the BMEmode gives the most probable value. Furthermore, the E
values for both the BMEmean (E = 0.032) and the BMEmode (E = 0.044)
are substantially smaller than that of SKME (E = 0.070). The above results
illustrate the fact that by rigorously accounting for the knowledge contained
in the probabilistic soft data, the BME method can improve the accuracy
of spatiotemporal mapping substantially compared to the traditional kriging
methods.
Figure 12.9. Estimation error distributions, BMEmode, BMEmean, SKh, and
SKME for pdf-2.
In the following example we revisit Kansas and the Equus Beds aquifer,
which was studied with the help of the BME method in Chapter 8 (p. 155).
Access to accurate and informative maps is quite valuable in the implementa-
tion of strategies to improve the water quality of aquifers, which is the case in
the Kansas Equus Beds Recharge Demonstration Project.
EXAMPLE 12.10: Most traditional kriging techniques derive confidence inter-
vals based on the restrictive assumption of a Gaussian posterior pdf (Olea,
1999). As a consequence, space/time estimates that have been produced us-
ing kriging are more uncertain than those produced using the BME approach.
For comparison purposes, the 90% confidence intervals obtained from the anal-
ysis of the Equus Beds aquifer data set (see p. 156-163) were calculated using
both the BME and the SK techniques. As discussed in Chapter 8, this data