
Page 19 - Multidimensional Chromatography
P. 19
8 Multidimensional Chromatography
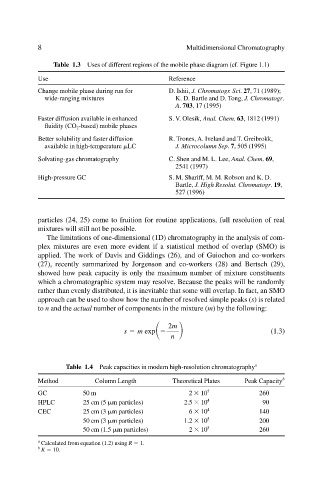
Table 1.3 Uses of different regions of the mobile phase diagram (cf. Figure 1.1)
Use Reference
Change mobile phase during run for D. Ishii, J. Chromatogr. Sci. 27, 71 (1989);
wide-ranging mixtures K. D. Bartle and D. Tong, J. Chromatogr.
A. 703, 17 (1995)
Faster diffusion available in enhanced S. V. Olesik, Anal. Chem. 63, 1812 (1991)
fluidity (CO 2 -based) mobile phases
Better solubility and faster diffusion R. Trones, A. Iveland and T. Greibrokk,
available in high-temperature LC J. Microcolumn Sep. 7, 505 (1995)
Solvating-gas chromatography C. Shen and M. L. Lee, Anal. Chem. 69,
2541 (1997)
High-pressure GC S. M. Shariff, M. M. Robson and K. D.
Bartle, J. High Resolut. Chromatogr. 19,
527 (1996)
particles (24, 25) come to fruition for routine applications, full resolution of real
mixtures will still not be possible.
The limitations of one-dimensional (1D) chromatography in the analysis of com-
plex mixtures are even more evident if a statistical method of overlap (SMO) is
applied. The work of Davis and Giddings (26), and of Guiochon and co-workers
(27), recently summarized by Jorgenson and co-workers (28) and Bertsch (29),
showed how peak capacity is only the maximum number of mixture constituents
which a chromatographic system may resolve. Because the peaks will be randomly
rather than evenly distributed, it is inevitable that some will overlap. In fact, an SMO
approach can be used to show how the number of resolved simple peaks (s) is related
to n and the actual number of components in the mixture (m) by the following:
2m
s m exp (1.3)
n
Table 1.4 Peak capacities in modern high-resolution chromatography a
Method Column Length Theoretical Plates Peak Capacity b
GC 50 m 2 10 5 260
HPLC 25 cm (5 m particles) 2.5 10 4 90
CEC 25 cm (3 m particles) 6 10 4 140
50 cm (3 m particles) 1.2 10 5 200
50 cm (1.5 m particles) 2 10 5 260
a
Calculated from equation (1.2) using R 1.
b
K 10.