
Page 175 - Book Hosokawa Nanoparticle Technology Handbook
P. 175
3.5 INTERACTIONS BETWEEN PARTICLES FUNDAMENTALS
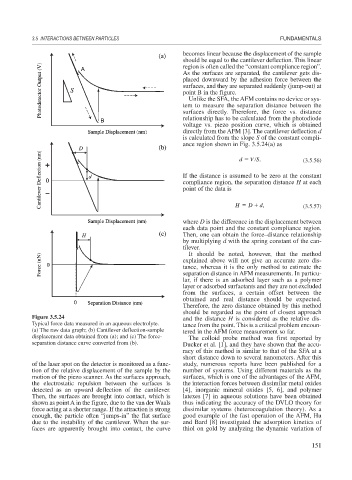
becomes linear because the displacement of the sample
should be equal to the cantilever deflection. This linear
region is often called the “constant compliance region”.
As the surfaces are separated, the cantilever gets dis-
placed downward by the adhesion force between the
surfaces, and they are separated suddenly (jump-out) at
point B in the figure.
Unlike the SFA, the AFM contains no device or sys-
tem to measure the separation distance between the
surfaces directly. Therefore, the force vs. distance
relationship has to be calculated from the photodiode
voltage vs. piezo position curve, which is obtained
directly from the AFM [3]. The cantilever deflection d
is calculated from the slope S of the constant compli-
ance region shown in Fig. 3.5.24(a) as
d V S. (3.5.56)
If the distance is assumed to be zero at the constant
compliance region, the separation distance H at each
point of the data is
H D d, (3.5.57)
where D is the difference in the displacement between
each data point and the constant compliance region.
Then, one can obtain the force–distance relationship
by multiplying d with the spring constant of the can-
tilever.
It should be noted, however, that the method
explained above will not give an accurate zero dis-
tance, whereas it is the only method to estimate the
separation distance in AFM measurements. In particu-
lar, if there is an adsorbed layer such as a polymer
layer or adsorbed surfactants and they are not excluded
from the surfaces, a certain offset between the
obtained and real distance should be expected.
Therefore, the zero distance obtained by this method
should be regarded as the point of closest approach
Figure 3.5.24 and the distance H is considered as the relative dis-
Typical force data measured in an aqueous electrolyte. tance from the point. This is a critical problem encoun-
(a) The raw data graph; (b) Cantilever deflection-sample tered in the AFM force measurement so far.
displacement data obtained from (a); and (c) The force- The colloid probe method was first reported by
separation distance curve converted from (b). Ducker et al. [1], and they have shown that the accu-
racy of this method is similar to that of the SFA at a
short distance down to several nanometers. After this
of the laser spot on the detector is monitored as a func- study, numerous reports have been published for a
tion of the relative displacement of the sample by the number of systems. Using different materials as the
motion of the piezo scanner. As the surfaces approach, surfaces, which is one of the advantages of the AFM,
the electrostatic repulsion between the surfaces is the interaction forces between dissimilar metal oxides
detected as an upward deflection of the cantilever. [4], inorganic mineral oxides [5, 6], and polymer
Then, the surfaces are brought into contact, which is latexes [7] in aqueous solutions have been obtained
shown as point A in the figure, due to the van der Waals thus indicating the accuracy of the DVLO theory for
force acting at a shorter range. If the attraction is strong dissimilar systems (heterocoagulation theory). As a
enough, the particle often “jumps-in” the flat surface good example of the fast operation of the AFM, Hu
due to the instability of the cantilever. When the sur- and Bard [8] investigated the adsorption kinetics of
faces are apparently brought into contact, the curve thiol on gold by analyzing the dynamic variation of
151