
Page 185 - Book Hosokawa Nanoparticle Technology Handbook
P. 185
3.6 AGGREGATION AND DISPERSION, CHARACTERIZATION AND CONTROL FUNDAMENTALS
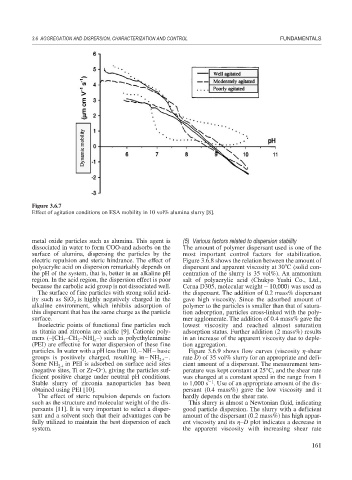
Figure 3.6.7
Effect of agitation conditions on ESA mobility in 10 vol% alumina slurry [8].
metal oxide particles such as alumina. This agent is (5) Various factors related to dispersion stability
dissociated in water to form COO-and adsorbs on the The amount of polymer dispersant used is one of the
surface of alumina, dispersing the particles by the most important control factors for stabilization.
electric repulsion and steric hindrance. The effect of Figure 3.6.8 shows the relation between the amount of
polyacrylic acid on dispersion remarkably depends on dispersant and apparent viscosity at 30 C (solid con-
the pH of the system, that is, better in an alkaline pH centration of the slurry is 35 vol%). An ammonium
region. In the acid region, the dispersion effect is poor salt of polyacrylic acid (Chukyo Yushi Co., Ltd.,
because the carbolic acid group is not dissociated well. Cerna D305, molecular weight 10,000) was used as
The surface of fine particles with strong solid acid- the dispersant. The addition of 0.2 mass% dispersant
ity such as SiO is highly negatively charged in the gave high viscosity. Since the adsorbed amount of
2
alkaline environment, which inhibits adsorption of polymer to the particles is smaller than that of satura-
this dispersant that has the same charge as the particle tion adsorption, particles cross-linked with the poly-
surface. mer agglomerate. The addition of 0.4 mass% gave the
Isoelectric points of functional fine particles such lowest viscosity and reached almost saturation
as titania and zirconia are acidic [9]. Cationic poly- adsorption status. Further addition (2 mass%) results
mers (–[CH –CH –NH] –) such as polyethylenimine in an increase of the apparent viscosity due to deple-
2
2
n
(PEI) are effective for water dispersion of these fine tion aggregation.
particles. In water with a pH less than 10,–NH– basic Figure 3.6.9 shows flow curves (viscosity -shear
groups is positively charged, resulting in– NH –. rate D) of 35 vol% slurry for an appropriate and defi-
2
Some NH 2 in PEI is adsorbed on surface acid sites cient amount of a dispersant. The measurement tem-
–
(negative sites, Ti or Zr–O ), giving the particles suf- perature was kept constant at 25°C, and the shear rate
ficient positive charge under neutral pH conditions. was changed at a constant speed in the range from 1
1
Stable slurry of zirconia nanoparticles has been to 1,000 s . Use of an appropriate amount of the dis-
obtained using PEI [10]. persant (0.4 mass%) gave the low viscosity and it
The effect of steric repulsion depends on factors hardly depends on the shear rate.
such as the structure and molecular weight of the dis- This slurry is almost a Newtonian fluid, indicating
persants [11]. It is very important to select a disper- good particle dispersion. The slurry with a deficient
sant and a solvent such that their advantages can be amount of the dispersant (0.2 mass%) has high appar-
fully utilized to maintain the best dispersion of each ent viscosity and its –D plot indicates a decrease in
system. the apparent viscosity with increasing shear rate
161