
Page 547 - Book Hosokawa Nanoparticle Technology Handbook
P. 547
24 CLOSELY PACKED COLLOIDAL CRYSTAL APPLICATIONS
Furthermore, the structural color varies according
to the solvents due to swelling ability of PDMS
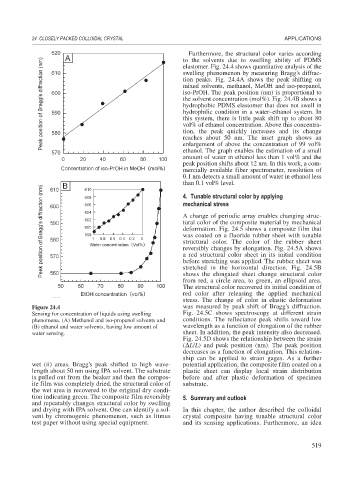
elastomer. Fig. 24.4 shows quantitative analysis of the
swelling phenomenon by measuring Bragg’s diffrac-
tion peaks. Fig. 24.4A shows the peak shifting on
mixed solvents, methanol, MeOH and iso-propanol,
iso-PrOH. The peak position (nm) is proportional to
the solvent concentration (mol%). Fig. 24.4B shows a
hydrophobic PDMS elastomer that does not swell in
hydrophilic condition in a water–ethanol system. In
this system, there is little peak shift up to about 80
vol% of ethanol concentration. Above this concentra-
tion, the peak quickly increases and its change
reaches about 50 nm. The inset graph shows an
enlargement of above the concentration of 99 vol%
ethanol. The graph enables the estimation of a small
amount of water in ethanol less than 1 vol% and the
peak position shifts about 12 nm. In this work, a com-
mercially available fiber spectrometer, resolution of
0.1 nm detects a small amount of water in ethanol less
than 0.1 vol% level.
4. Tunable structural color by applying
mechanical stress
A change of periodic array enables changing struc-
tural color of the composite material by mechanical
deformation. Fig. 24.5 shows a composite film that
was coated on a fluoride rubber sheet with tunable
structural color. The color of the rubber sheet
reversibly changes by elongation. Fig. 24.5A shows
a red structural color sheet in its initial condition
before stretching was applied. The rubber sheet was
stretched in the horizontal direction. Fig. 24.5B
shows the elongated sheet change structural color
from red, a circle area, to green, an ellipsoid area.
The structural color recovered its initial condition of
red color after releasing the applied mechanical
stress. The change of color in elastic deformation
Figure 24.4 was measured by peak shift of Bragg’s diffraction.
Sensing for concentration of liquids using swelling Fig. 24.5C shows spectroscopy at different strain
phenomena. (A) Methanol and iso-propanol solvents and conditions. The reflectance peak shifts toward low
(B) ethanol and water solvents, having low amount of wavelength as a function of elongation of the rubber
water sensing. sheet. In addition, the peak intensity also decreased.
Fig. 24.5D shows the relationship between the strain
( L/L) and peak position (nm). The peak position
decreases as a function of elongation. This relation-
ship can be applied to strain gages. As a further
wet (ii) areas. Bragg’s peak shifted to high wave- potential application, the composite film coated on a
length about 50 nm using IPA solvent. The substrate plastic sheet can display local strain distribution
is pulled out from the beaker and then the compos- before and after plastic deformation of specimen
ite film was completely dried, the structural color of substrate.
the wet area is recovered to the original dry condi-
tion indicating green. The composite film reversibly 5. Summary and outlook
and repeatably changes structural color by swelling
and drying with IPA solvent. One can identify a sol- In this chapter, the author described the colloidal
vent by chromogenic phenomenon, such as litmus crystal composite having tunable structural color
test paper without using special equipment. and its sensing applications. Furthermore, an idea
519