
Page 619 - Book Hosokawa Nanoparticle Technology Handbook
P. 619
40 EVALUATION AND APPLICATIONS OF DISPERSING CNT IN THE POLYMERS APPLICATIONS
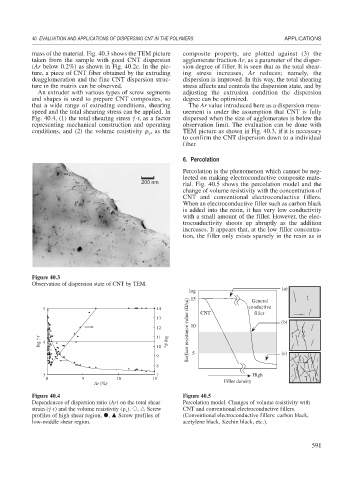
mass of the material. Fig. 40.3 shows the TEM picture composite property, are plotted against (3) the
taken from the sample with good CNT dispersion agglomerate fraction Ar, as a parameter of the disper-
(Ar below 0.2%) as shown in Fig. 40.2c. In the pic- sion degree of filler. It is seen that as the total shear-
ture, a piece of CNT fiber obtained by the extruding ing stress increases, Ar reduces; namely, the
deagglomeration and the fine CNT dispersion struc- dispersion is improved. In this way, the total shearing
ture in the matrix can be observed. stress affects and controls the dispersion state, and by
An extruder with various types of screw segments adjusting the extrusion condition the dispersion
and shapes is used to prepare CNT composites, so degree can be optimized.
that a wide range of extruding conditions, shearing The Ar value introduced here as a dispersion meas-
speed and the total shearing stress can be applied. In urement is under the assumption that CNT is fully
·.
Fig. 40.4, (1) the total shearing stress t, as a factor dispersed when the size of agglomerates is below the
representing mechanical construction and operating observation limit. The evaluation can be done with
conditions, and (2) the volume resistivity , as the TEM picture as shown in Fig. 40.3, if it is necessary
v
to confirm the CNT dispersion down to a individual
fiber.
6. Percolation
Percolation is the phenomenon which cannot be neg-
lected on making electroconductive composite mate-
200 nm rial. Fig. 40.5 shows the percolation model and the
change of volume resistivity with the concentration of
CNT and conventional electroconductive fillers.
When an electroconductive filler such as carbon black
is added into the resin, it has very low conductivity
with a small amount of the filler. However, the elec-
troconductivity shoots up abruptly as the addition
increases. It appears that, at the low filler concentra-
tion, the filler only exists sparsely in the resin as in
Figure 40.3
Observation of dispersion state of CNT by TEM.
(a)
log
15
Surface resistance value (Ω/sq)
General
5 14 CNT conductive
filler
13 (b)
12 10
log ·t 4 10 log ρ v
. 11
9 5 (c)
8
3 7 High
0 5 10 15
Ar (%) Filler density
Figure 40.4 Figure 40.5
Dependences of dispersion ratio (Ar) on the total shear Percolation model. Changes of volume resistivity with
·
strain ( ·t) and the volume resistivity ( ). , Screw CNT and conventional electroconductive fillers.
v
profiles of high shear region, , Screw profiles of (Conventional electroconductive fillers: carbon black,
low-middle shear region. acetylene black, Kechin black, etc.).
591