
Page 618 - Book Hosokawa Nanoparticle Technology Handbook
P. 618
APPLICATIONS 40 EVALUATION AND APPLICATIONS OF DISPERSING CNT IN THE POLYMERS
4. Dispersion of composites and its evaluation
Although it was not necessary for nanomaterials, a
number of reports discussed the dispersion of com-
posite materials and investigated their particle mor-
phology and the composite properties using
transmission electron microscope (TEM) or scanning
electron microscope (SEM). However, most of them,
the pictures of TEM or SEM, were compared and
evaluated visually; but the dispersion state of com-
posites was not handled numerically. For quantita-
tively evaluating the dispersion state of composites, it
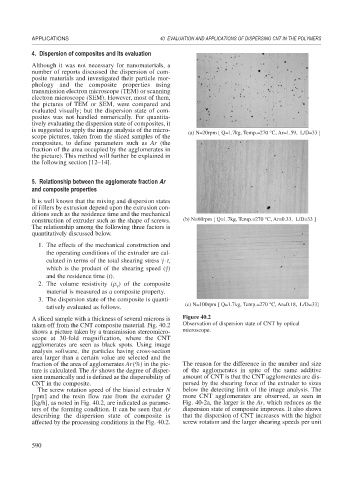
is suggested to apply the image analysis of the micro- (a) N=20rpm [ Q=1.7kg, Temp.=270 °C, Ar=1.59, L/D=33 ]
scope pictures, taken from the sliced samples of the
composites, to define parameters such as Ar (the
fraction of the area occupied by the agglomerates in
the picture). This method will further be explained in
the following section [12–14].
5. Relationship between the agglomerate fraction Ar
and composite properties
It is well known that the mixing and dispersion states
of fillers by extrusion depend upon the extrusion con-
ditions such as the residence time and the mechanical
construction of extruder such as the shape of screws. (b) N=60rpm [ Q=1.7kg, Temp.=270 °C, Ar=0.33, L/D=33 ]
The relationship among the following three factors is
quantitatively discussed below.
1. The effects of the mechanical construction and
the operating conditions of the extruder are cal-
·.
culated in terms of the total shearing stress t,
·
which is the product of the shearing speed ( )
and the residence time (t).
2. The volume resistivity ( ) of the composite
v
material is measured as a composite property.
3. The dispersion state of the composite is quanti-
tatively evaluated as follows. (c) N=100rpm [ Q=1.7kg, Temp.=270 °C, Ar=0.18, L/D=33]
A sliced sample with a thickness of several microns is Figure 40.2
taken off from the CNT composite material. Fig. 40.2 Observation of dispersion state of CNT by optical
shows a picture taken by a transmission stereomicro- microscope.
scope at 30-fold magnification, where the CNT
agglomerates are seen as black spots. Using image
analysis software, the particles having cross-section
area larger than a certain value are selected and the
fraction of the area of agglomerates Ar(%) in the pic- The reason for the difference in the number and size
ture is calculated. The Ar shows the degree of disper- of the agglomerates in spite of the same additive
sion numerically and is defined as the dispersibility of amount of CNT is that the CNT agglomerates are dis-
CNT in the composite. persed by the shearing force of the extruder to sizes
The screw rotation speed of the biaxial extruder N below the detecting limit of the image analysis. The
[rpm] and the resin flow rate from the extruder Q more CNT agglomerates are observed, as seen in
[kg/h], as noted in Fig. 40.2, are indicated as parame- Fig. 40-2a, the larger is the Ar, which reduces as the
ters of the forming condition. It can be seen that Ar dispersion state of composite improves. It also shows
describing the dispersion state of composite is that the dispersion of CNT increases with the higher
affected by the processing conditions in the Fig. 40.2. screw rotation and the larger shearing speeds per unit
590