
Page 28 - Numerical Analysis Using MATLAB and Excel
P. 28
Using MATLAB to Make Plots
drawn unless they are selected. The default line is the solid line.
1
sin(x) sin(x+2*pi/3) sin(x+4*pi/3)
0.5
0
-0.5
-1
0 1 2 3 4 5 6 7
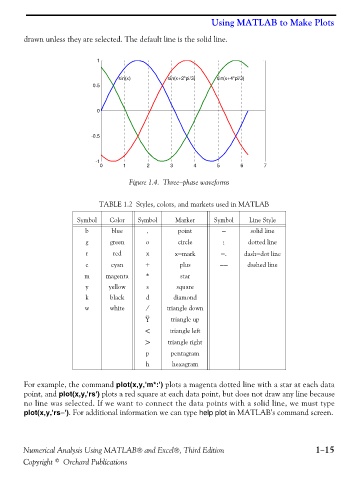
Figure 1.4. Three−phase waveforms
TABLE 1.2 Styles, colors, and markets used in MATLAB
Symbol Color Symbol Marker Symbol Line Style
b blue . point − solid line
g green o circle : dotted line
r red x x−mark −. dash−dot line
c cyan + plus −− dashed line
m magenta * star
y yellow s square
k black d diamond
w white ⁄ triangle down
Ÿ triangle up
< triangle left
> triangle right
p pentagram
h hexagram
For example, the command plot(x,y,'m*:') plots a magenta dotted line with a star at each data
point, and plot(x,y,'rs') plots a red square at each data point, but does not draw any line because
no line was selected. If we want to connect the data points with a solid line, we must type
plot(x,y,'rs−'). For additional information we can type help plot in MATLAB’s command screen.
Numerical Analysis Using MATLAB® and Excel®, Third Edition 1−15
Copyright © Orchard Publications