
Page 312 - Numerical Analysis Using MATLAB and Excel
P. 312
Chapter 7 Finite Differences and Interpolation
fprintf('Interpolated Value of z at x = −1 and y = 2 is z = %4.2f \n',z_int)
fprintf(' \n')
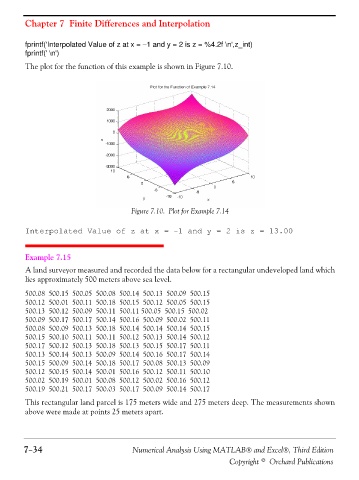
The plot for the function of this example is shown in Figure 7.10.
Figure 7.10. Plot for Example 7.14
Interpolated Value of z at x = -1 and y = 2 is z = 13.00
Example 7.15
A land surveyor measured and recorded the data below for a rectangular undeveloped land which
lies approximately 500 meters above sea level.
500.08 500.15 500.05 500.08 500.14 500.13 500.09 500.15
500.12 500.01 500.11 500.18 500.15 500.12 500.05 500.15
500.13 500.12 500.09 500.11 500.11 500.05 500.15 500.02
500.09 500.17 500.17 500.14 500.16 500.09 500.02 500.11
500.08 500.09 500.13 500.18 500.14 500.14 500.14 500.15
500.15 500.10 500.11 500.11 500.12 500.13 500.14 500.12
500.17 500.12 500.13 500.18 500.13 500.15 500.17 500.11
500.13 500.14 500.13 500.09 500.14 500.16 500.17 500.14
500.15 500.09 500.14 500.18 500.17 500.08 500.13 500.09
500.12 500.15 500.14 500.01 500.16 500.12 500.11 500.10
500.02 500.19 500.01 500.08 500.12 500.02 500.16 500.12
500.19 500.21 500.17 500.03 500.17 500.09 500.14 500.17
This rectangular land parcel is 175 meters wide and 275 meters deep. The measurements shown
above were made at points 25 meters apart.
7−34 Numerical Analysis Using MATLAB® and Excel®, Third Edition
Copyright © Orchard Publications