
Page 311 - Numerical Analysis Using MATLAB and Excel
P. 311
Interpolation with MATLAB
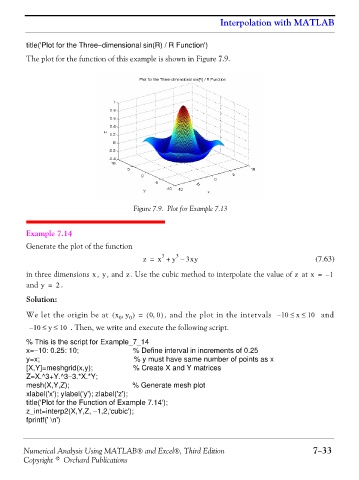
title('Plot for the Three−dimensional sin(R) / R Function')
The plot for the function of this example is shown in Figure 7.9.
Figure 7.9. Plot for Example 7.13
Example 7.14
Generate the plot of the function
3
3
z = x + y – 3xy (7.63)
z
xy
z
in three dimensions , , and . Use the cubic method to interpolate the value of at x = – 1
and y = . 2
Solution:
,
We let the origin be at x y,( 0 0 ) ( = 00 ) , and the plot in the intervals – 10 ≤ x ≤ 10 and
– 10 ≤ y ≤ 10 . Then, we write and execute the following script.
% This is the script for Example_7_14
x=−10: 0.25: 10; % Define interval in increments of 0.25
y=x; % y must have same number of points as x
[X,Y]=meshgrid(x,y); % Create X and Y matrices
Z=X.^3+Y.^3−3.*X.*Y;
mesh(X,Y,Z); % Generate mesh plot
xlabel('x'); ylabel('y'); zlabel('z');
title('Plot for the Function of Example 7.14');
z_int=interp2(X,Y,Z, −1,2,'cubic');
fprintf(' \n')
Numerical Analysis Using MATLAB® and Excel®, Third Edition 7−33
Copyright © Orchard Publications