Page 309 - Numerical Analysis Using MATLAB and Excel
P. 309

Interpolation with MATLAB


                %
                % Use the following five statements to obtain |Z| versus radian frequency w
                w=300:100:3000;
                z=zeros(28,2);
                z(:,1)=w';
                z(:,2)=(10+(10.^4−j.*10.^6./w)./(10+j.*(0.1.*w−10.^5./w)))';
                fprintf('%2.0f\t %10.3f\n',abs(z)')
                %
                w=[300 400 500 600 700 800 900 1000 1100 1200 1300 1400 1500....
                                        1600 1700 1800 1900 2000 2100 2200 2300....
                                        2400 2500 2600 2700 2800 2900 3000];
                z=[39.339 52.789 71.104 97.665 140.437 222.182 436.056 1014.938...
                                        469.830 266.032 187.052 145.751 120.353...
                                        103.111 90.603 81.088 73.588 67.513 62.481...
                                        58.240 54.611 51.468 48.717 46.286 44.122...
                                        42.182 40.432 38.845];
                semilogx(w,z); grid;
                title('Magnitude of Impedance vs. Radian Frequency');
                xlabel('w in rads/sec'); ylabel('|Z| in Ohms');
                %
                zi=interp1(w,z,792,'spline');
                fprintf(' \n')
                fprintf('Magnitude of Z at w=792 rad/s is %6.3f Ohms \n', zi)
                fprintf(' \n')
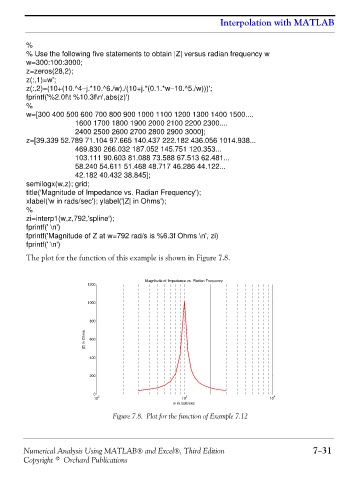
                The plot for the function of this example is shown in Figure 7.8.


                                                    Magnitude of Impedance vs. Radian Frequency
                                   1200


                                   1000

                                   800
                                  |Z| in Ohms  600


                                   400

                                   200


                                    0
                                      2                         3                         4
                                    10                         10                        10
                                                            w in rads/sec
                                          Figure 7.8. Plot for the function of Example 7.12


               Numerical Analysis Using MATLAB® and Excel®, Third Edition                             7−31
               Copyright © Orchard Publications
   304   305   306   307   308   309   310   311   312   313   314