
Page 304 - Numerical Analysis Using MATLAB and Excel
P. 304
Chapter 7 Finite Differences and Interpolation
Example 7.10
The i – v (current−voltage) relation of a non−linear electrical device is given by
it() = 0.1 e ( 0.2v t() – 1 ) (7.59)
where is in volts and in milliamperes. Compute for 30 data points of within the interval
i
v
v
i
2 ≤( v ≤ 5 ) – , plot versus in this range, and using linear interpolation compute when
i
v
i
v = 1.265 volts.
Solution:
We are required to use 30 data points within the given range; accordingly, we will use the MAT-
LAB linspace(first_value, last_value, number_of_values) command. The script below pro-
duces 30 values in volts, the corresponding values in milliamperes, and plots the data for this
range. Then, we use the interp1(x,y,x ) command to interpolate at the desired value.
i
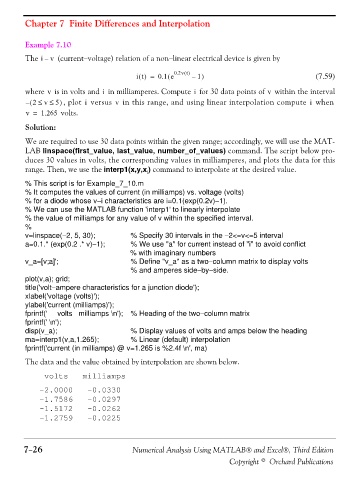
% This script is for Example_7_10.m
% It computes the values of current (in milliamps) vs. voltage (volts)
% for a diode whose v−i characteristics are i=0.1(exp(0.2v)−1).
% We can use the MATLAB function 'interp1' to linearly interpolate
% the value of milliamps for any value of v within the specified interval.
%
v=linspace(−2, 5, 30); % Specify 30 intervals in the −2<=v<=5 interval
a=0.1.* (exp(0.2 .* v)−1); % We use "a" for current instead of "i" to avoid conflict
% with imaginary numbers
v_a=[v;a]'; % Define "v_a" as a two−column matrix to display volts
% and amperes side−by−side.
plot(v,a); grid;
title('volt−ampere characteristics for a junction diode');
xlabel('voltage (volts)');
ylabel('current (milliamps)');
fprintf(' volts milliamps \n'); % Heading of the two−column matrix
fprintf(' \n');
disp(v_a); % Display values of volts and amps below the heading
ma=interp1(v,a,1.265); % Linear (default) interpolation
fprintf('current (in milliamps) @ v=1.265 is %2.4f \n', ma)
The data and the value obtained by interpolation are shown below.
volts milliamps
-2.0000 -0.0330
-1.7586 -0.0297
-1.5172 -0.0262
-1.2759 -0.0225
7−26 Numerical Analysis Using MATLAB® and Excel®, Third Edition
Copyright © Orchard Publications