Page 316 - Numerical Analysis Using MATLAB and Excel
P. 316

Chapter 7  Finite Differences and Interpolation


                size(zzi)

                ans =
                   111    71
                zmax=max(max(zzi)) % Estimates the peak of the terrain

                zmax =
                  500.2108

                m =
                   111
                n=
                     9
                xmax =
                    20
                ymax =
                   275
                                                                       x
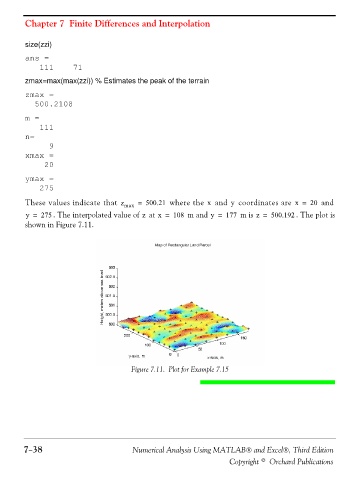
                These values indicate that  z max  =  500.21  where the   and   coordinates are  x =  20  and
                                                                              y
                                                   z
                y =  275 . The interpolated value of   at x =  108  m and y =  177  m is z =  500.192 . The plot is
                shown in Figure 7.11.


                                                Figure 7.11. Plot for Example 7.15


               7−38                             Numerical Analysis Using MATLAB® and Excel®, Third Edition
                                                                             Copyright © Orchard Publications
   311   312   313   314   315   316   317   318   319   320   321