
Page 36 - Numerical Analysis Using MATLAB and Excel
P. 36
Multiplication, Division and Exponentiation
displaying up to four windows of different plots.
Example 1.14
Plot the functions
⁄
,
,
,
⋅
y = sin 2 x z = cos 2 x w = sin 2 x cos 2 x v = sin 2 x cos 2 x (1.18)
in the interval 0x2π using 100 data points. Use the subplot command to display these func-
≤
≤
tions on four windows on the same graph.
Solution:
The MATLAB script to produce the four subplots is as follows:
x=linspace(0, 2*pi,100); % Interval with 100 data points
y=(sin(x) .^ 2); z=(cos(x) .^ 2);
w=y .* z;
v=y ./ (z+eps); % add eps to avoid division by zero
subplot(221); % upper left of four subplots
plot(x,y); axis([0 2*pi 0 1]);
title('y=(sinx)^2');
subplot(222); % upper right of four subplots
plot(x,z); axis([0 2*pi 0 1]);
title('z=(cosx)^2');
subplot(223); % lower left of four subplots
plot(x,w); axis([0 2*pi 0 0.3]);
title('w=(sinx)^2*(cosx)^2');
subplot(224); % lower right of four subplots
plot(x,v); axis([0 2*pi 0 400]);
title('v=(sinx)^2/(cosx)^2');
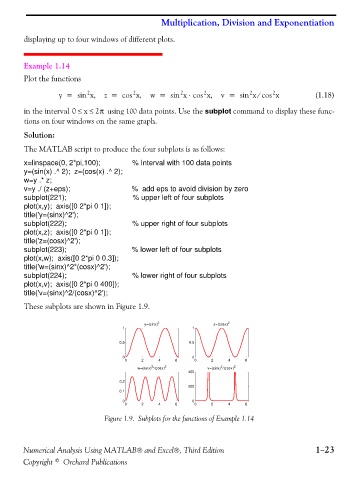
These subplots are shown in Figure 1.9.
2 2
y=(sinx) z=(cosx)
1 1
0.5 0.5
0 0
0 2 4 6 0 2 4 6
2 2 2 2
w=(sinx) *(cosx) v=(sinx) /(cosx)
400
0.2
200
0.1
0 0
0 2 4 6 0 2 4 6
Figure 1.9. Subplots for the functions of Example 1.14
Numerical Analysis Using MATLAB® and Excel®, Third Edition 1−23
Copyright © Orchard Publications