
Page 38 - Numerical Analysis Using MATLAB and Excel
P. 38
Multiplication, Division and Exponentiation
%
% The first five statements (next two lines) compute and plot Re{z}
real_part=real(z); plot(w,real_part); grid;
xlabel('radian frequency w'); ylabel('Real part of Z');
%
% The next five statements (next two lines) compute and plot Im{z}
imag_part=imag(z); plot(w,imag_part); grid;
xlabel('radian frequency w'); ylabel('Imaginary part of Z');
% The last six statements (next six lines) below produce the polar plot of z
mag=abs(z);% Computes |Z|
rndz=round(abs(z));% Rounds |Z| to read polar plot easier
theta=angle(z);% Computes the phase angle of impedance Z
polar(theta,rndz);% Angle is the first argument
grid;
ylabel('Polar Plot of Z');
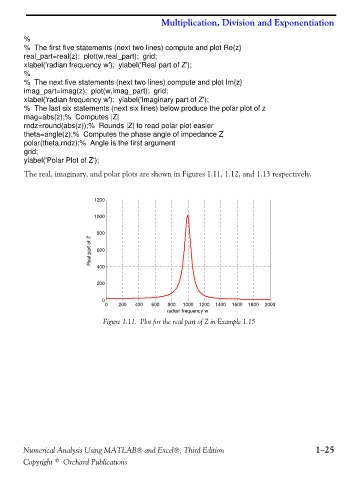
The real, imaginary, and polar plots are shown in Figures 1.11, 1.12, and 1.13 respectively.
1200
1000
800
Real part of Z 600
400
200
0
0 200 400 600 800 1000 1200 1400 1600 1800 2000
radian frequency w
Figure 1.11. Plot for the real part of Z in Example 1.15
Numerical Analysis Using MATLAB® and Excel®, Third Edition 1−25
Copyright © Orchard Publications