
Page 42 - Numerical Analysis Using MATLAB and Excel
P. 42
Script and Function Files
100
80
60
40
20
0
-20
-40
-1.5 -1 -0.5 0 0.5 1 1.5
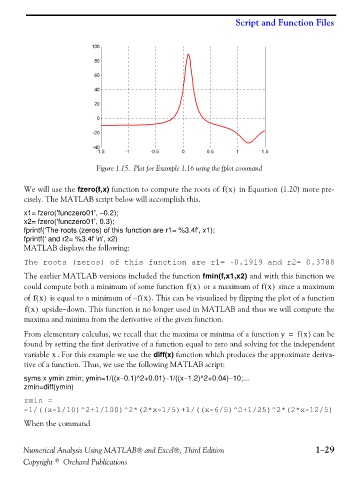
Figure 1.15. Plot for Example 1.16 using the fplot command
We will use the fzero(f,x) function to compute the roots of fx() in Equation (1.20) more pre-
cisely. The MATLAB script below will accomplish this.
x1= fzero('funczero01', −0.2);
x2= fzero('funczero01', 0.3);
fprintf('The roots (zeros) of this function are r1= %3.4f', x1);
fprintf(' and r2= %3.4f \n', x2)
MATLAB displays the following:
The roots (zeros) of this function are r1= -0.1919 and r2= 0.3788
The earlier MATLAB versions included the function fmin(f,x1,x2) and with this function we
could compute both a minimum of some function fx() or a maximum of fx() since a maximum
of fx() is equal to a minimum of fx() . This can be visualized by flipping the plot of a function
–
fx() upside−down. This function is no longer used in MATLAB and thus we will compute the
maxima and minima from the derivative of the given function.
From elementary calculus, we recall that the maxima or minima of a function y = fx() can be
found by setting the first derivative of a function equal to zero and solving for the independent
variable . For this example we use the diff(x) function which produces the approximate deriva-x
tive of a function. Thus, we use the following MATLAB script:
syms x ymin zmin; ymin=1/((x−0.1)^2+0.01)−1/((x−1.2)^2+0.04)−10;...
zmin=diff(ymin)
zmin =
-1/((x-1/10)^2+1/100)^2*(2*x-1/5)+1/((x-6/5)^2+1/25)^2*(2*x-12/5)
When the command
Numerical Analysis Using MATLAB® and Excel®, Third Edition 1−29
Copyright © Orchard Publications