
Page 55 - Numerical Analysis Using MATLAB and Excel
P. 55
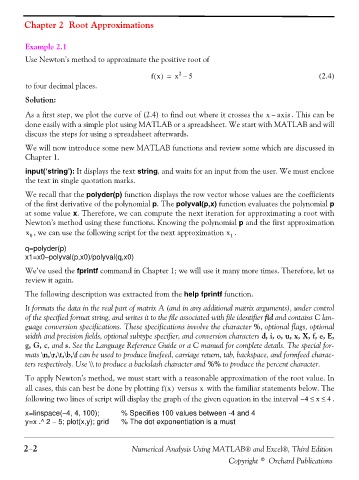
Chapter 2  Root Approximations


                Example 2.1

                Use Newton’s method to approximate the positive root of

                                                              2
                                                      fx() =  x –  5                                    (2.4)
                to four decimal places.
                Solution:

                As a first step, we plot the curve of (2.4) to find out where it crosses the x –  axis . This can be
                done easily with a simple plot using MATLAB or a spreadsheet. We start with MATLAB and will
                discuss the steps for using a spreadsheet afterwards.
                We will now introduce some new MATLAB functions and review some which are discussed in
                Chapter 1.

                input(‘string’): It displays the text string, and waits for an input from the user. We must enclose
                the text in single quotation marks.

                We recall that the polyder(p) function displays the row vector whose values are the coefficients
                of the first derivative of the polynomial p. The polyval(p,x) function evaluates the polynomial p
                at some value x. Therefore, we can compute the next iteration for approximating a root with
                Newton’s method using these functions. Knowing the polynomial p and the first approximation
                x 0 , we can use the following script for the next approximation x 1 .


                q=polyder(p)
                x1=x0−polyval(p,x0)/polyval(q,x0)
                We’ve used the fprintf command in Chapter 1; we will use it many more times. Therefore, let us
                review it again.

                The following description was extracted from the help fprintf function.
                It formats the data in the real part of matrix A (and in any additional matrix arguments), under control
                of the specified format string, and writes it to the file associated with file identifier fid and contains C lan-
                guage conversion specifications. These specifications involve the character %, optional flags, optional
                width and precision fields, optional subtype specifier, and conversion characters d, i, o, u, x, X, f, e, E,
                g, G, c, and s. See the Language Reference Guide or a C manual for complete details. The special for-
                mats \n,\r,\t,\b,\f can be used to produce linefeed, carriage return, tab, backspace, and formfeed charac-
                ters respectively. Use \\ to produce a backslash character and %% to produce the percent character.
                To apply Newton’s method, we must start with a reasonable approximation of the root value. In
                all cases, this can best be done by plotting fx()  versus   with the familiar statements below. The
                                                                    x
                following two lines of script will display the graph of the given equation in the interval  4 ≤–  x ≤  . 4


                x=linspace(−4, 4, 100);      % Specifies 100 values between -4 and 4
                y=x .^ 2 − 5; plot(x,y); grid  % The dot exponentiation is a must


               2−2                              Numerical Analysis Using MATLAB® and Excel®, Third Edition
                                                                             Copyright © Orchard Publications