
Page 420 - Op Amps Design, Applications, and Troubleshooting
P. 420
396 NONIDEAL OP AMP CHARACTERISTICS
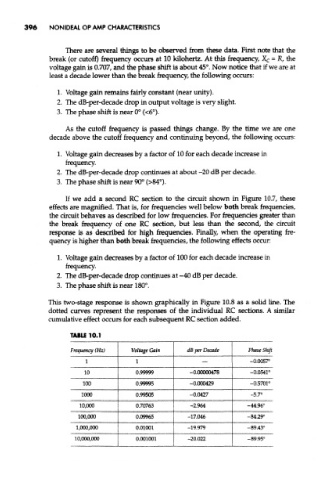
There are several things to be observed from these data. First note that the
break (or cutoff) frequency occurs at 10 kilohertz. At this frequency, X c = R, the
voltage gain is 0.707, and the phase shift is about 45°. Now notice that if we are at
least a decade lower than the break frequency, the following occurs:
1. Voltage gain remains fairly constant (near unity).
2. The dB-per-decade drop in output voltage is very slight.
3. The phase shift is near 0° (<6°).
As the cutoff frequency is passed things change. By the time we are one
decade above the cutoff frequency and continuing beyond, the following occurs:
1. Voltage gain decreases by a factor of 10 for each decade increase in
frequency.
2. The dB-per-decade drop continues at about -20 dB per decade.
3. The phase shift is near 90° (>84°).
If we add a second RC section to the circuit shown in Figure 10.7, these
effects are magnified. That is, for frequencies well below both break frequencies,
the circuit behaves as described for low frequencies. For frequencies greater than
the break frequency of one RC section, but less than the second, the circuit
response is as described for high frequencies. Finally, when the operating fre-
quency is higher than both break frequencies, the following effects occur:
1. Voltage gain decreases by a factor of 100 for each decade increase in
frequency.
2. The dB-per-decade drop continues at -40 dB per decade.
3. The phase shift is near 180°.
This two-stage response is shown graphically in Figure 10.8 as a solid line. The
dotted curves represent the responses of the individual RC sections. A similar
cumulative effect occurs for each subsequent RC section added.
TABLE 10.1
Frequency (Hz) Voltage Gain dB per Decade Phase Shift
I 1 — -0.0057°
10 0.99999 -0.00000478 -0.0541°
100 0.99995 -0.000429 -0.5701°
1000 0.99505 -0.0427 -5.7°
10,000 0.70763 -2.964 -44.96°
100,000 0.09965 -17.046 -84.29°
1,000,000 0.01001 -19.979 -89.43°
10,000,000 0.001001 -20.022 -89.95°