
Page 74 - Op Amps Design, Applications, and Troubleshooting
P. 74
inverting Amplifier 57
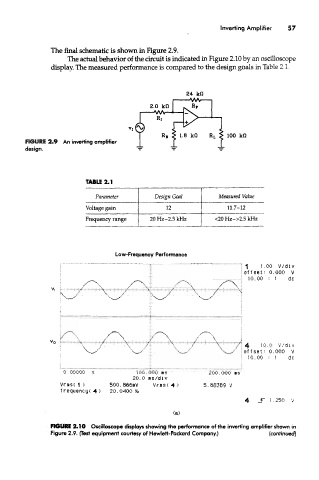
The final schematic is shown in Figure 2.9.
The actual behavior of the circuit is indicated in Figure 2.10 by an oscilloscope
display. The measured performance is compared to the design goals in Table 2,1.
FIGURE 2.9 An inverting amplifier
design.
TABLE 2.1
Parameter Design Goal Measured Value
Voltage gain 12 11.7-12
Frequency range 20 Hz -2.5 kHz <20 Hz->2.5 kHz
FIGURE 2.10 Oscilloscope displays showing the performance of the inverting amplifier shown in
Figure 2.9. {Test equipment courtesy of Hewlett-Packard Company.) (contfnued)