
Page 277 - Optical Communications Essentials
P. 277
Optical Link Design
Optical Link Design 267
pus network, then operation in the 800- to 900-nm region may be desirable to
save on component costs. On the other hand, if the transmission distance is rel-
atively long and the bit rate is high, the lower attenuation and smaller disper-
sion of the O- or C-bands may be more advantageous.
After a wavelength has been chosen, the next step is to interrelate the system
performances of the three major optical link building blocks, that is, the
receiver, transmitter, and optical fiber. Normally the designer chooses the char-
acteristics of two of these elements and then computes those of the third to see
if the system performance requirements are met. The procedure we shall follow
here is to select first the photodetector and then the optical source. Then one
can see how far signals can be sent over a particular fiber before an amplifier is
needed.
16.2.1. Power budgeting process
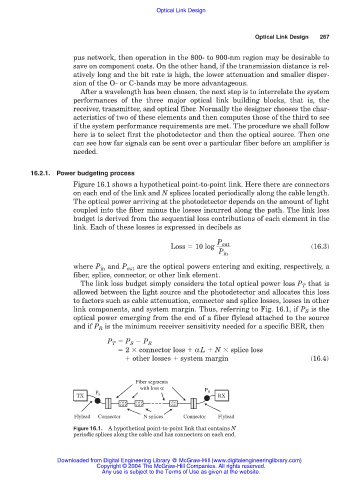
Figure 16.1 shows a hypothetical point-to-point link. Here there are connectors
on each end of the link and N splices located periodically along the cable length.
The optical power arriving at the photodetector depends on the amount of light
coupled into the fiber minus the losses incurred along the path. The link loss
budget is derived from the sequential loss contributions of each element in the
link. Each of these losses is expressed in decibels as
P out
Loss 10 log (16.3)
P in
where P in and P out are the optical powers entering and exiting, respectively, a
fiber, splice, connector, or other link element.
The link loss budget simply considers the total optical power loss P T that is
allowed between the light source and the photodetector and allocates this loss
to factors such as cable attenuation, connector and splice losses, losses in other
link components, and system margin. Thus, referring to Fig. 16.1, if P S is the
optical power emerging from the end of a fiber flylead attached to the source
and if P R is the minimum receiver sensitivity needed for a specific BER, then
P T P S P R
2 connector loss αL N splice loss
other losses system margin (16.4)
Fiber segments
with loss α
P R
P S
TX RX
RX
TX
Flylead Connector N splices Connector Flylead
Figure 16.1. A hypothetical point-to-point link that contains N
periodic splices along the cable and has connectors on each end.
Downloaded from Digital Engineering Library @ McGraw-Hill (www.digitalengineeringlibrary.com)
Copyright © 2004 The McGraw-Hill Companies. All rights reserved.
Any use is subject to the Terms of Use as given at the website.