
Page 278 - Optical Communications Essentials
P. 278
Optical Link Design
268 Chapter Sixteen
where α is the fiber attenuation (dB/km) and L is the link length. As noted
in Sec. 16.1.2, the link margin normally is selected to be between 3 and 10dB.
Now let us look at some examples of how to calculate a link loss budget.
We will use examples of links operating at 850nm, at 1310nm, and in the
C-band.
16.2.2. Fast Ethernet LAN example
A Fast Ethernet link is known as a 100BASE-T link. Typically such a link is used
in a local-area network (LAN) and runs at 100Mbps. Since the distance is short,
we can use components operating at 850nm, which are less expensive than
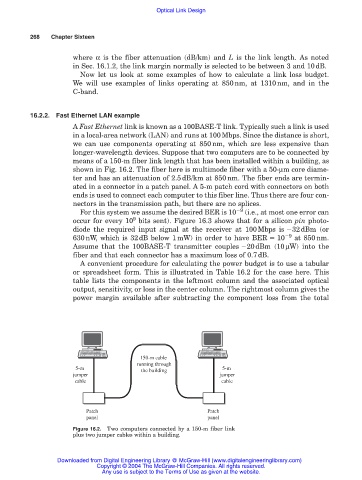
longer-wavelength devices. Suppose that two computers are to be connected by
means of a 150-m fiber link length that has been installed within a building, as
shown in Fig. 16.2. The fiber here is multimode fiber with a 50-µm core diame-
ter and has an attenuation of 2.5dB/km at 850nm. The fiber ends are termin-
ated in a connector in a patch panel. A 5-m patch cord with connectors on both
ends is used to connect each computer to this fiber line. Thus there are four con-
nectors in the transmission path, but there are no splices.
For this system we assume the desired BER is 10 9 (i.e., at most one error can
9
occur for every 10 bits sent). Figure 16.3 shows that for a silicon pin photo-
diode the required input signal at the receiver at 100Mbps is 32dBm (or
630nW, which is 32dB below 1mW) in order to have BER 10 9 at 850nm.
Assume that the 100BASE-T transmitter couples 20dBm (10µW) into the
fiber and that each connector has a maximum loss of 0.7dB.
A convenient procedure for calculating the power budget is to use a tabular
or spreadsheet form. This is illustrated in Table 16.2 for the case here. This
table lists the components in the leftmost column and the associated optical
output, sensitivity, or loss in the center column. The rightmost column gives the
power margin available after subtracting the component loss from the total
150-m cable
running through
5-m the building 5-m
jumper jumper
cable cable
Patch Patch
panel panel
Figure 16.2. Two computers connected by a 150-m fiber link
plus two jumper cables within a building.
Downloaded from Digital Engineering Library @ McGraw-Hill (www.digitalengineeringlibrary.com)
Copyright © 2004 The McGraw-Hill Companies. All rights reserved.
Any use is subject to the Terms of Use as given at the website.