
Page 297 - Origin and Prediction of Abnormal Formation Pressures
P. 297
268 H.H. RIEKE, G.V. CHILINGAR AND J.O. ROBERTSON JR.
....................... T ........................ ":" .... |
!
! i + Na+
i
o i 4 K +
o
o ........................ [ .......................... .i. C& +
~. Mg ~+
x ,. SO, ~-
.~ cr
E ............................................... ~ ......................................... -I--TD s
.
ff
0
a ; .......................... : .......................... : .......................... ~ ...................................
e.- i
; ~
o
c-
O
o " " ~ i ....
i i "
i : 9
" i i "." :"
." :.
9 :,< ~ x x x x
:
..i .......................... i ................. -~ ....... ! ......................... I~ ...... I...I..~.11 ....... 9
_
:
:
1 10 1 O0 1000 10,000 100,000
Axial pressure, psi
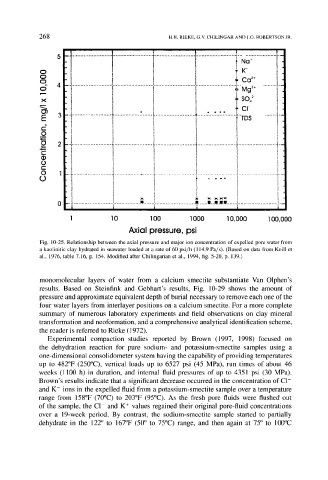
Fig. 10-25. Relationship between the axial pressure and major ion concentration of expelled pore water from
a kaolinitic clay hydrated in seawater loaded at a rate of 60 psi/h (114.9 Pa/s). (Based on data from Knill et
al., 1976, table 7.16, p. 154. Modified after Chilingarian et al., 1994, fig. 5-20, p. 139.)
monomolecular layers of water from a calcium smectite substantiate Van Olphen's
results. Based on Steinfink and Gebhart's results, Fig. 10-29 shows the amount of
pressure and approximate equivalent depth of burial necessary to remove each one of the
four water layers from interlayer positions on a calcium smectite. For a more complete
summary of numerous laboratory experiments and field observations on clay mineral
transformation and neoformation, and a comprehensive analytical identification scheme,
the reader is referred to Rieke (1972).
Experimental compaction studies reported by Brown (1997, 1998) focused on
the dehydration reaction for pure sodium- and potassium-smectite samples using a
one-dimensional consolidometer system having the capability of providing temperatures
up to 482~ (250~ vertical loads up to 6527 psi (45 MPa), run times of about 46
weeks (]100 h) in duration, and internal fluid pressures of up to 4351 psi (30 MPa).
Brown's results indicate that a significant decrease occurred in the concentration of C1-
and K + ions in the expelled fluid from a potassium-smectite sample over a temperature
range from 158~ (70~ to 203~ (95~ As the fresh pore fluids were flushed out
of the sample, the C1- and K + values regained their original pore-fluid concentrations
over a 19-week period. By contrast, the sodium-smectite sample started to partially
dehydrate in the 122 ~ to 167~ (50 ~ to 75~ range, and then again at 75 ~ to 100~