
Page 295 - Origin and Prediction of Abnormal Formation Pressures
P. 295
266 H.H. RIEKE, G.V. CHILINGAR AND J.O. ROBERTSON JR.
I
i
I
!
,
.~
_
,
I
--v ........................ . .................................................. r ......................... "f ........................ :-- I
! , i ~ : ~ ! 9 ! 1 Na + t .." i '
;'
i
.
: ! : ! 9 t . .i-v+ i . 4
E:)
CD : ' I ,k ~_2+ i "
:
O 4 9 .: ......................... :" : ................ " ": ".. " ! . . . . . . . . . . . . . . . . . . . . . I ~ f J : :.
O : - , ............................................ ~ Mg 2+ ......... ~--
p,.,.
. SO~ ~-
X i
Cl-
9 e
13') 3 9 ~. ......................... .- ......................... .,. .... .'. ................... I
IE " TDS
ff a
O
. i i o
-I--. .",..'. .................... ; ............................
2 ,,...: .......................... : ......................... .:. ..........................
. ~ "
r'
(1) : i x x : i "
O " K
E
O 1 --~ .......................... i ......................... ~ ........... ~ ' ; ; ! 2 ....................... i ......................... ~-
L)
---i ......................... ~ ...... * ......... * ..... i ..... * .... z~..,~..$..a.~.a~.a~ ......... i. ......................... }-.--
i | | t
1 10 1 O0 1000 1 O, 000 100,000
Axial pressure, psi
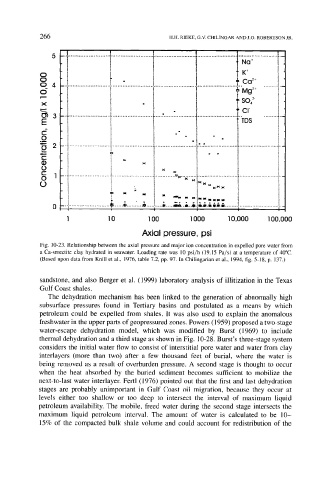
Fig. 10-23. Relationship between the axial pressure and major ion concentration in expelled pore water from
a Ca-smectite clay hydrated in seawater. Loading rate was 10 psi/h (19.15 Pa/s) at a temperature of 40~
(Based upon data from Knill et al., 1976, table 7.2, pp. 97. In Chilingarian et al., 1994, fig. 5-18, p. 137.)
sandstone, and also Berger et al. (1999) laboratory analysis of illitization in the Texas
Gulf Coast shales.
The dehydration mechanism has been linked to the generation of abnormally high
subsurface pressures found in Tertiary basins and postulated as a means by which
petroleum could be expelled from shales. It was also used to explain the anomalous
freshwater in the upper parts of geopressured zones. Powers (1959) proposed a two-stage
water-escape dehydration model, which was modified by Burst (1969) to include
thermal dehydration and a third stage as shown in Fig. 10-28. Burst's three-stage system
considers the initial water flow to consist of interstitial pore water and water from clay
interlayers (more than two) after a few thousand feet of burial, where the water is
being removed as a result of overburden pressure. A second stage is thought to occur
when the heat absorbed by the buried sediment becomes sufficient to mobilize the
next-to-last water interlayer. Fertl (1976) pointed out that the first and last dehydration
stages are probably unimportant in Gulf Coast oil migration, because they occur at
levels either too shallow or too deep to intersect the interval of maximum liquid
petroleum availability. The mobile, freed water during the second stage intersects the
maximum liquid petroleum interval. The amount of water is calculated to be 10-
15% of the compacted bulk shale volume and could account for redistribution of the