
Page 292 - Origin and Prediction of Abnormal Formation Pressures
P. 292
PORE WATER COMPACTION CHEMISTRY AS RELATED TO OVERPRESSURES 263
50,000
40,000 L
(3.
"a
0
30,000
>
0
"O
m
20,000
10,000
0 20 40 60 80 1 O0
Cumulative volume of
expelled fluid, ml
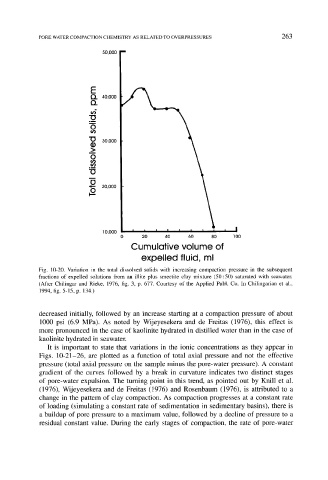
Fig. 10-20. Variation in the total dissolved solids with increasing compaction pressure in the subsequent
fractions of expelled solutions from an illite plus smectite clay mixture (50:50) saturated with seawater.
(After Chilingar and Rieke, 1976, fig. 3, p. 677. Courtesy of the Applied Publ. Co. In Chilingarian et al.,
1994, fig. 5-15, p. 134.)
decreased initially, followed by an increase starting at a compaction pressure of about
1000 psi (6.9 MPa). As noted by Wijeyesekera and de Freitas (1976), this effect is
more pronounced in the case of kaolinite hydrated in distilled water than in the case of
kaolinite hydrated in seawater.
It is important to state that variations in the ionic concentrations as they appear in
Figs. 10-21-26, are plotted as a function of total axial pressure and not the effective
pressure (total axial pressure on the sample minus the pore-water pressure). A constant
gradient of the curves followed by a break in curvature indicates two distinct stages
of pore-water expulsion. The turning point in this trend, as pointed out by Knill et al.
(1976), Wijeyesekera and de Freitas (1976) and Rosenbaum (1976), is attributed to a
change in the pattern of clay compaction. As compaction progresses at a constant rate
of loading (simulating a constant rate of sedimentation in sedimentary basins), there is
a buildup of pore pressure to a maximum value, followed by a decline of pressure to a
residual constant value. During the early stages of compaction, the rate of pore-water