
Page 174 - Phase Space Optics Fundamentals and Applications
P. 174
The Radon-Wigner Transform 155
or, equivalently,
d tan ( )
= 0 (4.108)
d
o
which leads to the optimal constraint
f 2
R o =− (4.109)
Z o
This condition transforms Eq. (4.103) into
f
l = 2R o + f − (4.110)
m o
Thus, the choice of a set of geometric parameters l, f , Z o , and d
o
fulfilling the two above equations provides a design prescription for
a first-order compensation of the chromatic blur in the diffraction
pattern located, for = o , at distance R o from the object. 54
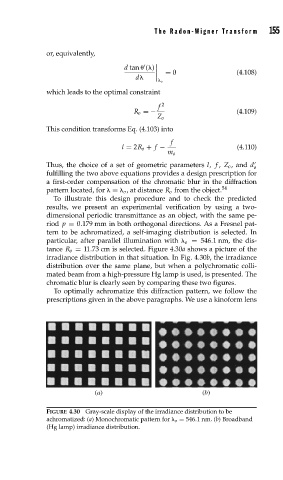
To illustrate this design procedure and to check the predicted
results, we present an experimental verification by using a two-
dimensional periodic transmittance as an object, with the same pe-
riod p = 0.179 mm in both orthogonal directions. As a Fresnel pat-
tern to be achromatized, a self-imaging distribution is selected. In
particular, after parallel illumination with o = 546.1 nm, the dis-
tance R o = 11.73 cm is selected. Figure 4.30a shows a picture of the
irradiance distribution in that situation. In Fig. 4.30b, the irradiance
distribution over the same plane, but when a polychromatic colli-
mated beam from a high-pressure Hg lamp is used, is presented. The
chromatic blur is clearly seen by comparing these two figures.
To optimally achromatize this diffraction pattern, we follow the
prescriptions given in the above paragraphs. We use a kinoform lens
(a) (b)
FIGURE 4.30 Gray-scale display of the irradiance distribution to be
achromatized: (a) Monochromatic pattern for o = 546.1 nm. (b) Broadband
(Hg lamp) irradiance distribution.