
Page 175 - Phase Space Optics Fundamentals and Applications
P. 175
156 Chapter Four
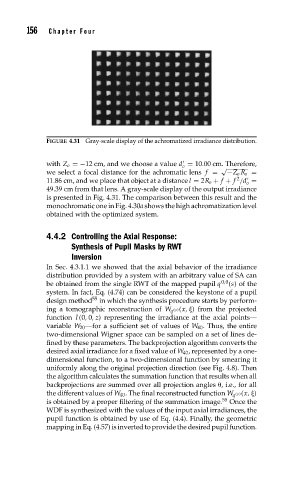
FIGURE 4.31 Gray-scale display of the achromatized irradiance distribution.
with Z o =−12 cm, and we choose a value d = 10.00 cm. Therefore,
o
√
we select a focal distance for the achromatic lens f = −Z o R o =
2
11.86 cm, and we place that object at a distance l = 2R o + f + f /d =
o
49.39 cm from that lens. A gray-scale display of the output irradiance
is presented in Fig. 4.31. The comparison between this result and the
monochromatic one in Fig. 4.30a shows the high achromatization level
obtained with the optimized system.
4.4.2 Controlling the Axial Response:
Synthesis of Pupil Masks by RWT
Inversion
In Sec. 4.3.1.1 we showed that the axial behavior of the irradiance
distribution provided by a system with an arbitrary value of SA can
be obtained from the single RWT of the mapped pupil q 0,0 (s) of the
system. In fact, Eq. (4.74) can be considered the keystone of a pupil
design method 55 in which the synthesis procedure starts by perform-
ing a tomographic reconstruction of W q (x, ) from the projected
0,0
function I (0, 0,z) representing the irradiance at the axial points—
variable W 20 —for a sufficient set of values of W 40 . Thus, the entire
two-dimensional Wigner space can be sampled on a set of lines de-
fined by these parameters. The backprojection algorithm converts the
desired axial irradiance for a fixed value of W 40 , represented by a one-
dimensional function, to a two-dimensional function by smearing it
uniformly along the original projection direction (see Fig. 4.8). Then
the algorithm calculates the summation function that results when all
backprojections are summed over all projection angles , i.e., for all
the different values of W 40 . The final reconstructed function W q (x, )
0,0
is obtained by a proper filtering of the summation image. 55 Once the
WDF is synthesized with the values of the input axial irradiances, the
pupil function is obtained by use of Eq. (4.4). Finally, the geometric
mapping in Eq. (4.57) is inverted to provide the desired pupil function.