
Page 179 - Phase Space Optics Fundamentals and Applications
P. 179
160 Chapter Four
1.0
Amplitude transmittance (a.u.) 0.8
0.6
0.4
0.2
0.0
230 235 240 245 250 255 260 265 270 275 280
Spatial coordinate (pixels)
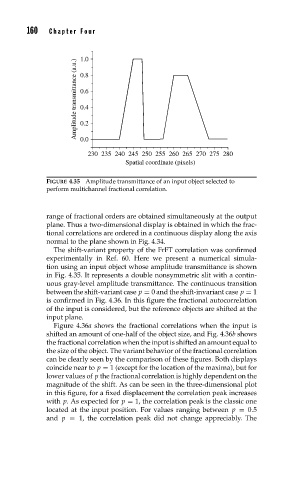
FIGURE 4.35 Amplitude transmittance of an input object selected to
perform multichannel fractional correlation.
range of fractional orders are obtained simultaneously at the output
plane. Thus a two-dimensional display is obtained in which the frac-
tional correlations are ordered in a continuous display along the axis
normal to the plane shown in Fig. 4.34.
The shift-variant property of the FrFT correlation was confirmed
experimentally in Ref. 60. Here we present a numerical simula-
tion using an input object whose amplitude transmittance is shown
in Fig. 4.35. It represents a double nonsymmetric slit with a contin-
uous gray-level amplitude transmittance. The continuous transition
between the shift-variant case p = 0 and the shift-invariant case p = 1
is confirmed in Fig. 4.36. In this figure the fractional autocorrelation
of the input is considered, but the reference objects are shifted at the
input plane.
Figure 4.36a shows the fractional correlations when the input is
shifted an amount of one-half of the object size, and Fig. 4.36b shows
the fractional correlation when the input is shifted an amount equal to
the size of the object. The variant behavior of the fractional correlation
can be clearly seen by the comparison of these figures. Both displays
coincide near to p = 1 (except for the location of the maxima), but for
lower values of p the fractional correlation is highly dependent on the
magnitude of the shift. As can be seen in the three-dimensional plot
in this figure, for a fixed displacement the correlation peak increases
with p. As expected for p = 1, the correlation peak is the classic one
located at the input position. For values ranging between p = 0.5
and p = 1, the correlation peak did not change appreciably. The