
Page 71 - Photodetection and Measurement - Maximizing Performance in Optical Systems
P. 71
Fundamental Noise Basics and Calculations
64 Chapter Three
light source for a high-resolution scanner or make use of the wide availability of fiber
connectors, “connectorized” detectors, power splitters, and optical bench hardware to
ease the construction. Perhaps you want to do measurements of their birefringence
properties at a wide range of wavelengths, and a selection of LEDs is much cheaper
than a tunable laser. Take an ordinary visible-wavelength LED, say a bright blue one
(470nm), and remove the molded lens to get down to within a few hundred microns
of the chip surface (see Chap. 6 for instructions). Drive the LED at its rated peak
current with a square-wave generator at 3kHz. Take one of your 100-MW receivers
designed using the above principles, and make sure it is totally light-tight in a
grounded metal box. Check too that it is working properly. Waft the modulated LED
near to the slightly open lid, and you will see nice square waves and plenty of receiver
bandwidth register on the oscilloscope.
Let’s make life easy for now and use a standard telecomms-type fiber (e.g., a few
meters of Corning SMF28, but anything similar will do). Couple the cleaved fiber end
to the LED. You could use an XYZ micromanipulator, but with that big chip adhesive
tape holding the fiber and a few bending adjustments of the LED leads should couple
well enough. There is even room for several fibers. Most important: switch the lights
off or put a blackout sheet over your head, and make sure that blue light is coming
out of the fiber end. Put the fiber at about 250mm from your eye. If you can see the
light, you should have no difficulty measuring it.
Couple the other end of the fiber to the photodiode. Again, sticky tape and judicious
bending will work, although a precision V-groove fiber holder or connectorized detec-
tor and “bare-fiber coupler” make life easier still. Observe the oscilloscope. I got about
200mV from the 100MW transimpedance (2nA or about 8nW). On the spectrum ana-
lyzer, I measured a signal of -6dBm and a noise level in the vicinity of 3kHz of
-88dBm in 45Hz bandwidth. So a S/N of 82dB in this bandwidth, useless for
telecomms but ample for a lot of laboratory and instrumentation measurements. Note
that the receiver is not optimized for lowest noise. It is clear that you don’t neces-
sarily have to restrict yourself to lasers or even to the design wavelengths of single-
mode fibers. There will be a few modes there, but if all you want is a small light source,
this may suffice. If you want to take this experiment further, you can do the same
with a single-mode fiber designed for 470nm. Their core area is another order of mag-
nitude smaller, but even with 0.1nA photocurrent high resolution, low bandwidth
measurements are possible.
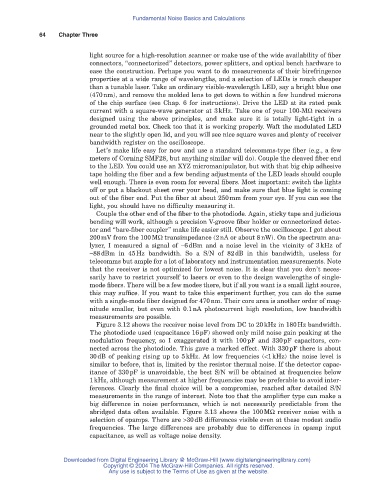
Figure 3.12 shows the receiver noise level from DC to 20kHz in 180Hz bandwidth.
The photodiode used (capacitance 16pF) showed only mild noise gain peaking at the
modulation frequency, so I exaggerated it with 100pF and 330pF capacitors, con-
nected across the photodiode. This gave a marked effect. With 330pF there is about
30dB of peaking rising up to 5kHz. At low frequencies (<1kHz) the noise level is
similar to before, that is, limited by the resistor thermal noise. If the detector capac-
itance of 330pF is unavoidable, the best S/N will be obtained at frequencies below
1kHz, although measurement at higher frequencies may be preferable to avoid inter-
ferences. Clearly the final choice will be a compromise, reached after detailed S/N
measurements in the range of interest. Note too that the amplifier type can make a
big difference in noise performance, which is not necessarily predictable from the
abridged data often available. Figure 3.13 shows the 100MW receiver noise with a
selection of opamps. There are >30dB differences visible even at these modest audio
frequencies. The large differences are probably due to differences in opamp input
capacitance, as well as voltage noise density.
Downloaded from Digital Engineering Library @ McGraw-Hill (www.digitalengineeringlibrary.com)
Copyright © 2004 The McGraw-Hill Companies. All rights reserved.
Any use is subject to the Terms of Use as given at the website.