
Page 76 - Photodetection and Measurement - Maximizing Performance in Optical Systems
P. 76
Fundamental Noise Basics and Calculations
Fundamental Noise Basics and Calculations 69
R 1 = Q R 3 = Q R 5 = Q G = R 5 (3.24)
p
GC2p f o 2 ( Q - ) f o Cf o 2 R 1
G C2p
2
Even looking at the output of the filter on a scope can be useful. With a Q of
10, the filtered noise will look pretty much like a sine wave with variable ampli-
tude, and this peak-to-peak amplitude can be estimated as before or quantified
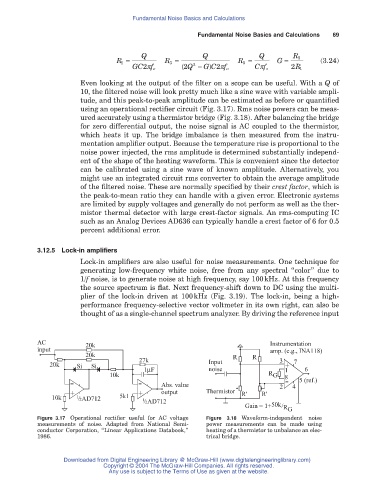
using an operational rectifier circuit (Fig. 3.17). Rms noise powers can be meas-
ured accurately using a thermistor bridge (Fig. 3.18). After balancing the bridge
for zero differential output, the noise signal is AC coupled to the thermistor,
which heats it up. The bridge imbalance is then measured from the instru-
mentation amplifier output. Because the temperature rise is proportional to the
noise power injected, the rms amplitude is determined substantially independ-
ent of the shape of the heating waveform. This is convenient since the detector
can be calibrated using a sine wave of known amplitude. Alternatively, you
might use an integrated circuit rms converter to obtain the average amplitude
of the filtered noise. These are normally specified by their crest factor, which is
the peak-to-mean ratio they can handle with a given error. Electronic systems
are limited by supply voltages and generally do not perform as well as the ther-
mistor thermal detector with large crest-factor signals. An rms-computing IC
such as an Analog Devices AD636 can typically handle a crest factor of 6 for 0.5
percent additional error.
3.12.5 Lock-in amplifiers
Lock-in amplifiers are also useful for noise measurements. One technique for
generating low-frequency white noise, free from any spectral “color” due to
1/f noise, is to generate noise at high frequency, say 100kHz. At this frequency
the source spectrum is flat. Next frequency-shift down to DC using the multi-
plier of the lock-in driven at 100kHz (Fig. 3.19). The lock-in, being a high-
performance frequency-selective vector voltmeter in its own right, can also be
thought of as a single-channel spectrum analyzer. By driving the reference input
AC 20k Instrumentation
input amp. (e.g., INA118)
20k R R
27k Input 3 7
20k Si Si +
1μF noise 1 6
10k R G - 5 (ref.)
8
Abs. value 2 4
output Thermistor R' R'
-
-
10k + 1 2 / AD712 5k1 + 1 2 / AD712
Gain = 1+ 50k / R
G
Figure 3.17 Operational rectifier useful for AC voltage Figure 3.18 Waveform-independent noise
measurements of noise. Adapted from National Semi- power measurements can be made using
conductor Corporation, “Linear Applications Databook,” heating of a thermistor to unbalance an elec-
1986. trical bridge.
Downloaded from Digital Engineering Library @ McGraw-Hill (www.digitalengineeringlibrary.com)
Copyright © 2004 The McGraw-Hill Companies. All rights reserved.
Any use is subject to the Terms of Use as given at the website.