
Page 115 - Photoreactive Organic Thin Films
P. 115
94 ZOUHEIR SEKKAT
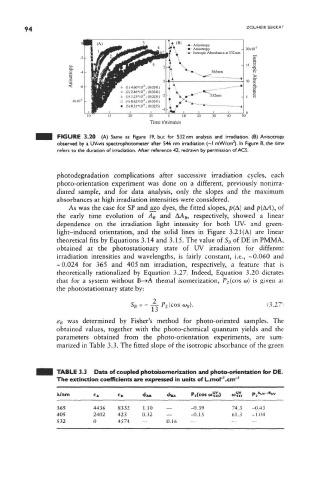
FIGURE 3.20 (A) Same as Figure 19, but for 532 nm analysis and irradiation, (B) Anisotropy
2
observed by a UV-vis spectrophotometer after 546 nm irradiation (~l mW/cm ). In Figure B, the time
refers to the duration of irradiation. After reference 42, redrawn by permission of ACS.
photodegradation complications after successive irradiation cycles, each
photo-orientation experiment was done on a different, previously nonirra-
diated sample, and for data analysis, only the slopes and the maximum
absorbances at high irradiation intensities were considered.
As was the case for SP andazo dyes, the fitted slopes, p(A) and p(AA), of
the early time evolution of A B and AA B, respectively, showed a linear
dependence on the irradiation light intensity for both UV- and green-
light-induced orientation, and the solid lines in Figure 3.21 (A) are linear
theoretical fits by Equations 3.14 and 3.15. The value of S B of DE in PMMA,
obtained at the photostationary state of UV irradiation for different
irradiation intensities and wavelengths, is fairly constant, i.e., -0.060 and
~ 0.024 for 365 and 405 nm irradiation, respectively, a feature that is
theoretically rationalized by Equation 3.27. Indeed, Equation 3.20 dictates
that for a system without B—>A themal isomerization, F 2(cos to) is given at
the photostationnary state by:
S B = -~P 2 (cos6> B ). (3.27}
% was determined by Fisher's method for photo-oriented samples. The
obtained values, together with the photo-chemical quantum yields and the
parameters obtained from the photo-orientation experiments, are sum-
marized in Table 3.3. The fitted slope of the isotropic absorbance of the green
TABLE 3.3 Data of coupled photoisomerization and photo-orientation for DE.
The extinction coefficients are expressed in units of L.mor'.cm" 1
X/nm e A e B <£ AB <£ BA P 2(cos 01^2) «Sa
365 4436 8332 1.10 — -0.39 74.3 -0.43
405 2402 423 0.32 — -0.15 61.3 -1.04
532 0 4574 — 0.16 — —