
Page 112 - Photoreactive Organic Thin Films
P. 112
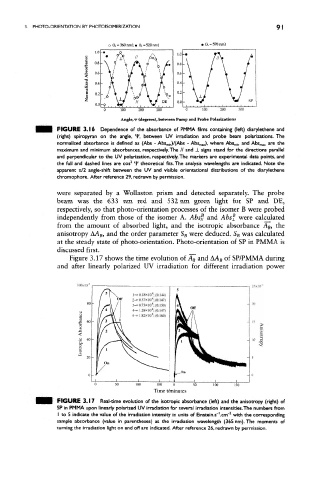
3. PHOTO-ORIENTATION BY PHOTOISOMERIZATION


                                  360nm);» (X = 520nm)    • (X = 570 ran)


                                                     0    100   200
                                  Angle, ¥ (degrees), between Pump and Probe Polarizations
                FIGURE 3, 1 6 Dependence of the absorbance of PMMA films containing (left) diarylethene and
                (right) spiropyran on the angle, *F, between UV irradiation and probe beam polarizations. The
               normalized absorbance is defined as (Abs - Abs min)/(Abs -  , where Abs min and Abs,^ are the
               maximum and minimum absorbances, respectively. The // and J_ signs stand for the directions parallel
               and perpendicular to the UV polarization, respectively. The markers are experimental data points, and
                                     2
               the full and dashed lines are cos  *P theoretical fits. The analysis wavelengths are indicated. Note the
               apparent it/2 angle-shift between the UV and visible orientational distributions of the diarylethene
               chromophore. After reference 29, redrawn by permission.

               were separated by a Wollaston prism and detected separately. The probe
                beam was the 633 nm red and 532 nm green light for SP and DE,
               respectively, so that photo-orientation processes of the isomer B were probed
               independently from those of the isomer A. Absf t and Absf were calculated
               from the amount of absorbed light, and the isotropic absorbance Ag, the
               anisotropy AA B, and the order parameter S B were deduced. S B was calculated
               at the steady state of photo-orientation. Photo-orientation of SP in PMMA is
               discussed first.
                   Figure 3.17 shows the time evolution of A B and AA B of SP/PMMA during
               and after linearly polarized UV irradiation for different irradiation power


                                      l-» 0.18X10"°; (0.144)
                                           8
                                      2-»0.37xlO" ; (0.147)
                                            !
                                      3-»0.73xlO~ ; (0.150)
                                            8
                                      4-* I.28xl0~ ;(0.147)
                                            8
                                      5-» 1.82XIO" ; (0.160)


                                             150  0     50
                                            Time t/minutes
               FIGURE 3.17 Real-time evolution of the isotropic absorbance (left) and the anisotropy (right) of
               SP in PMMA upon linearly polarized UV irradiation for several irradiation intensities.The numbers from
                                                                  2
                I to 5 indicate the value of the irradiation intensity in units of Einstein.s~'.cm~  with the corresponding
               sample absorbance (value in parentheses) at the irradiation wavelength (365 nm). The moments of
               turning the irradiation light on and off are indicated. After reference 26, redrawn by permission.