
Page 147 - Photoreactive Organic Thin Films
P. 147
126 ZOUHEIR SEKKAT AND WOLFGANG KNOLL
PI-1
Mean Absorbance
•o- Dichroic Ratio
-P 0.75-
c 0.70-
C3
5
4)
100 150 200 300
Time t (hours)
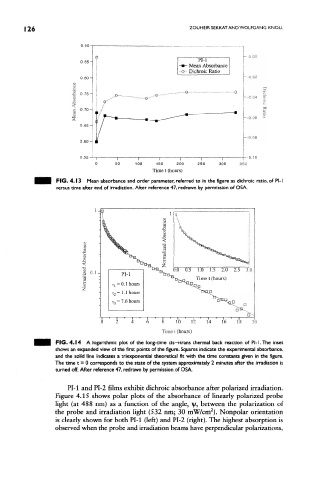
FIG. 4.13 Mean absorbance and order parameter, referred to in the figure as dichroic ratio, of PI-1
versus time after end of irradiation. After reference 47, redrawn by permission of OSA.
1.5 2.0 2!5
PI-1
Time t (hours)
TI =0.1 hours
T 2 = 1.1 hours
%-, = !,6 hours
10 12 14 16 18
Time t (hours)
FIG. 4.14 A logarithmic plot of the long-time cis— Hrans thermal back reaction of PI- 1. The inset
shows an expanded view of the first points of the figure. Squares indicate the experimental absorbance,
and the solid line indicates a triexponential theoretical fit with the time constants given in the figure.
The time t = 0 corresponds to die state of the system approximately 2 minutes after the irradiation is
turned off. After reference 47, redrawn by permission of OSA.
PI-1 and PI-2 films exhibit dichroic absorbance after polarized irradiation.
Figure 4.15 shows polar plots of the absorbance of linearly polarized probe
light (at 488 nm) as a function of the angle, \y, between the polarization of
2
the probe and irradiation light (532 nm; 30 mW/cm ). Nonpolar orientation
is clearly shown for both PI-1 (left) and PI-2 (right). The highest absorption is
observed when the probe and irradiation beams have perpendicular polarizations,